Technical Analysis of GM 2024-05-10
Overview:
In analyzing the technical indicators for GM over the last 5 days, we will delve into the trend, momentum, volatility, and volume indicators to provide a comprehensive outlook on the possible stock price movement in the coming days. By examining these key aspects, we aim to offer valuable insights and predictions for informed decision-making.
Trend Analysis:
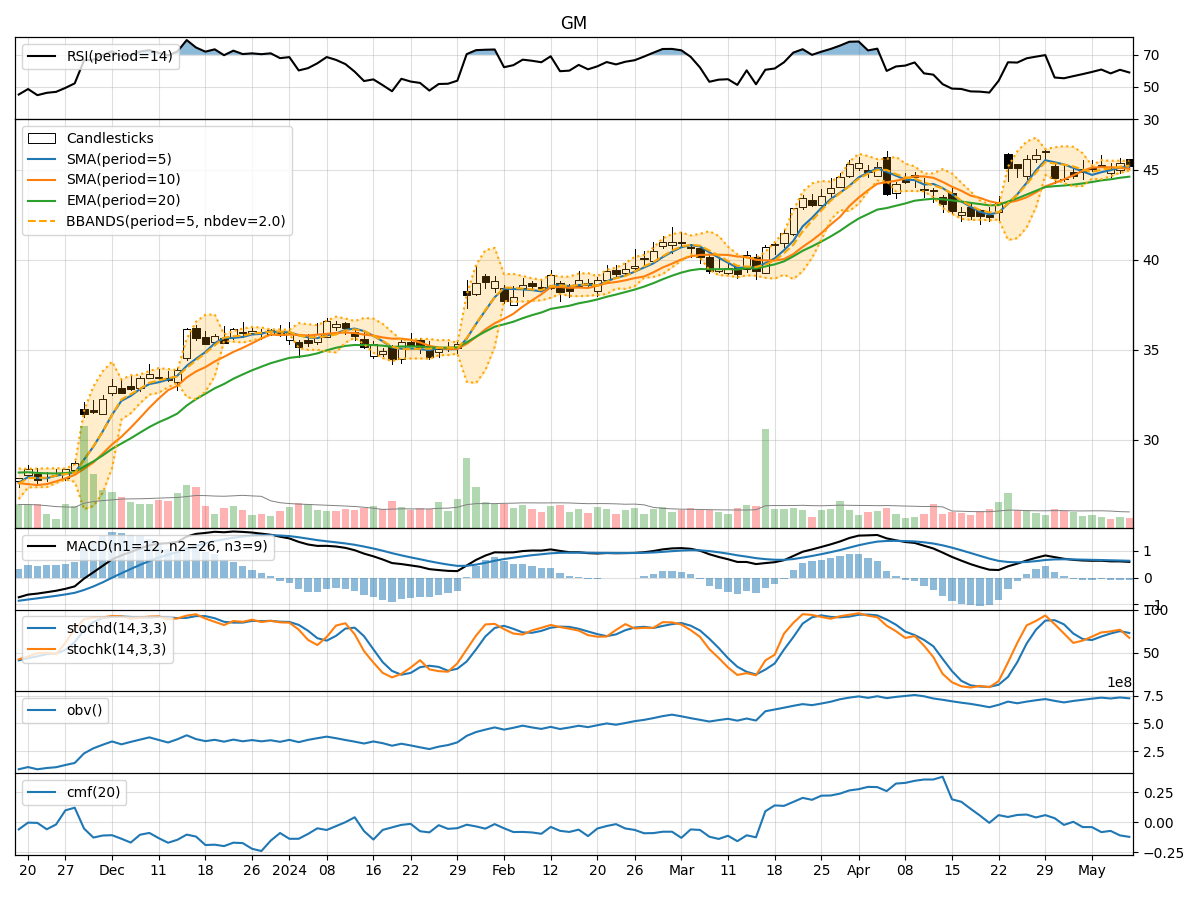
- Moving Averages (MA): The 5-day Moving Average (MA) has been consistently above the closing prices, indicating a potential bullish trend.
- MACD: The MACD line has been positive, suggesting upward momentum in the stock price.
- EMA: The Exponential Moving Average (EMA) has been trending upwards, supporting the bullish sentiment.
Momentum Analysis:
- RSI: The Relative Strength Index (RSI) has been fluctuating around the neutral zone, indicating a balanced momentum.
- Stochastic Oscillator: The Stochastic indicators have shown mixed signals, with some days indicating overbought conditions and others oversold.
Volatility Analysis:
- Bollinger Bands (BB): The Bollinger Bands have been relatively narrow, suggesting low volatility in the stock price.
- BB Percentage (BBP): The Bollinger Bands Percentage has been low, indicating a stable price movement.
Volume Analysis:
- On-Balance Volume (OBV): The OBV has shown a slight decrease, suggesting a potential decrease in buying pressure.
- Chaikin Money Flow (CMF): The CMF has been negative, indicating a bearish sentiment in terms of volume flow.
Key Observations:
- The trend indicators suggest a bullish outlook with positive moving averages and MACD.
- Momentum indicators show mixed signals with RSI hovering around neutrality and stochastic oscillating between overbought and oversold levels.
- Volatility indicators point towards low volatility and stable price movement.
- Volume indicators indicate a slight decrease in buying pressure and a bearish sentiment in volume flow.
Conclusion:
Based on the analysis of the technical indicators, the next few days for GM stock price movement could be sideways with a slight bearish bias. The bullish trend indicators are countered by the mixed momentum signals and bearish volume indicators. The low volatility suggests a stable price movement, but the decrease in buying pressure and negative CMF indicate a potential downside risk. Traders should exercise caution and closely monitor the price action for any signs of a trend reversal.