Technical Analysis of GNK 2024-05-10
Overview:
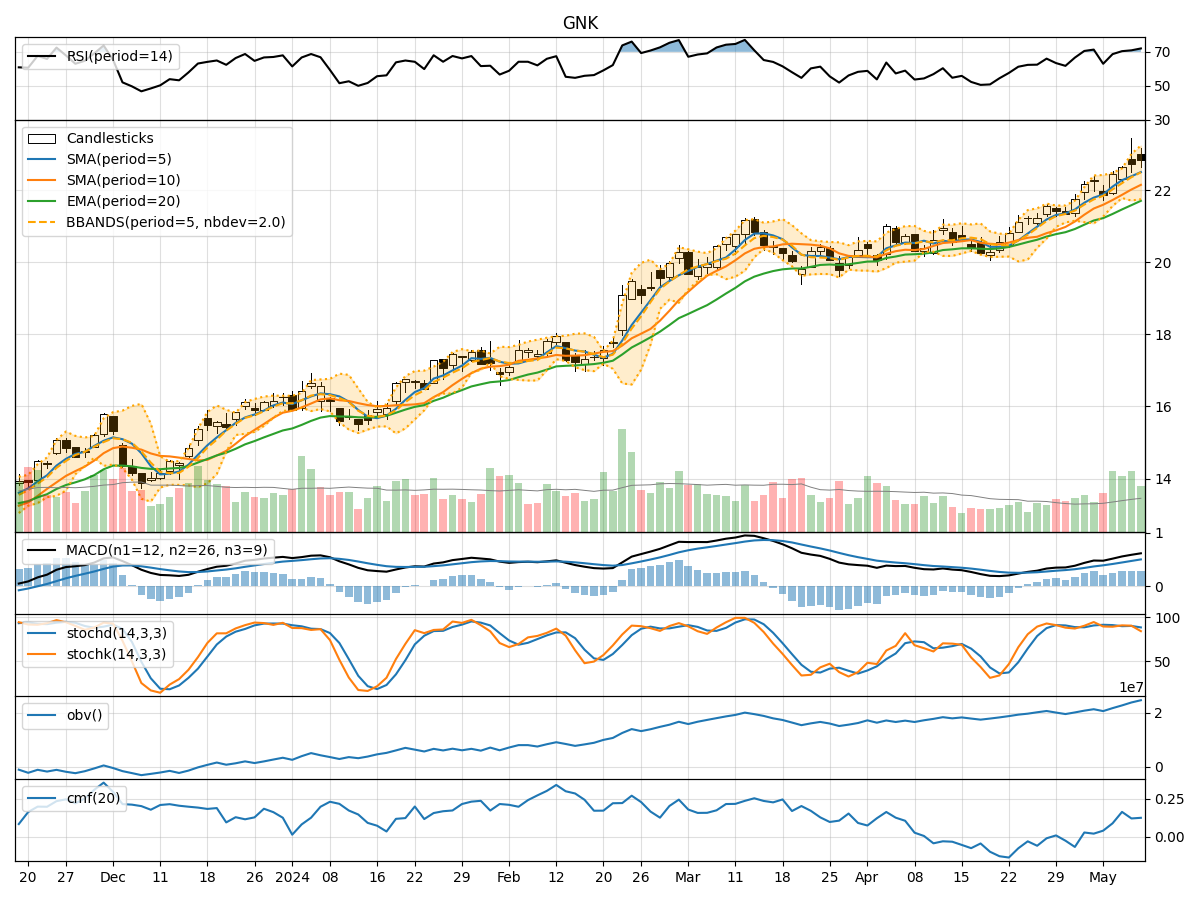
In analyzing the technical indicators for GNK over the last 5 days, we will delve into the trend, momentum, volatility, and volume indicators to provide a comprehensive outlook on the possible stock price movement in the coming days.
Trend Indicators:
- Moving Averages (MA): The 5-day Moving Average has been consistently above the Simple Moving Average (SMA) of 10 days, indicating a short-term bullish trend.
- Exponential Moving Average (EMA): The EMA has been showing an upward trend, suggesting positive price momentum.
- Moving Average Convergence Divergence (MACD): The MACD and Signal Line have been in positive territory, indicating bullish momentum.
Momentum Indicators:
- Relative Strength Index (RSI): RSI has been in the overbought territory, suggesting a potential pullback in the stock price.
- Stochastic Oscillator: Both %K and %D have been relatively high, indicating a strong bullish momentum.
- Williams %R (Willams %R): The Williams %R has been in the oversold region, signaling a potential reversal in the price trend.
Volatility Indicators:
- Bollinger Bands (BB): The stock price has been trading within the upper Bollinger Band, indicating a period of high volatility.
- Bollinger Band Width (BBW): The BBW has been expanding, suggesting increased price volatility.
- Bollinger Band %B (BBP): The %B has been fluctuating, indicating potential price reversals.
Volume Indicators:
- On-Balance Volume (OBV): The OBV has been steadily increasing, indicating strong buying pressure in the stock.
- Chaikin Money Flow (CMF): The CMF has been positive, suggesting that money is flowing into the stock.
Key Observations and Opinions:
- Trend: The trend indicators suggest a bullish sentiment in the short term.
- Momentum: While RSI indicates overbought conditions, the Stochastic Oscillator and Williams %R suggest strong bullish momentum.
- Volatility: The Bollinger Bands show high volatility, which could lead to sharp price movements.
- Volume: The increasing OBV and positive CMF indicate strong buying interest in the stock.
Conclusion:
Based on the analysis of the technical indicators, the next few days' possible stock price movement for GNK is likely to be upward with continued bullish momentum. However, caution is advised as the RSI indicates overbought conditions, and the high volatility could lead to sharp price swings. Traders should closely monitor the price action and consider setting appropriate stop-loss levels to manage risk effectively.