Technical Analysis of GNRC 2024-05-10
Overview:
In the last 5 trading days, GNRC stock has shown a mix of price movements and technical indicators. We will analyze the trend, momentum, volatility, and volume indicators to determine the possible future stock price movement.
Trend Analysis:
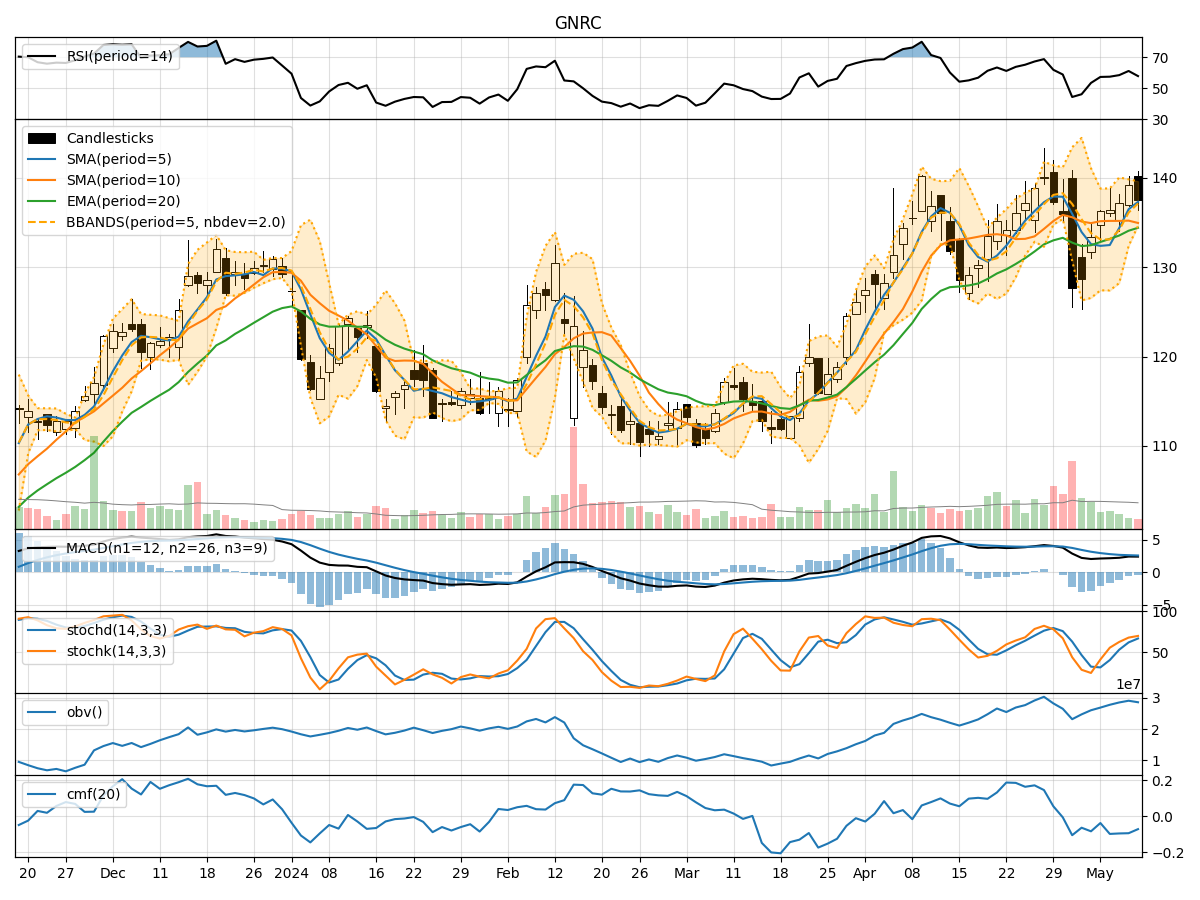
- Moving Averages (MA): The 5-day Moving Average (MA) has been consistently above the 10-day Simple Moving Average (SMA), indicating a short-term bullish trend.
- Exponential Moving Average (EMA): The 20-day EMA has been trending upwards, suggesting a bullish sentiment in the mid to long term.
- MACD: The MACD line has been above the signal line, indicating a bullish momentum.
Key Observation: The trend indicators suggest a bullish sentiment in both short and mid to long term.
Momentum Analysis:
- RSI: The Relative Strength Index (RSI) has been fluctuating around the 60 level, indicating a neutral momentum.
- Stochastic Oscillator: Both %K and %D lines of the Stochastic Oscillator have been in the overbought zone, suggesting a potential reversal.
- Williams %R: The Williams %R is hovering around the oversold territory, indicating a potential buying opportunity.
Key Observation: The momentum indicators show mixed signals with a slight bearish bias.
Volatility Analysis:
- Bollinger Bands (BB): The stock price has been trading within the Bollinger Bands, with the bands narrowing, indicating decreasing volatility.
Key Observation: Volatility has been decreasing, suggesting a period of consolidation or a potential breakout.
Volume Analysis:
- On-Balance Volume (OBV): The OBV has been relatively flat, indicating a balance between buying and selling pressure.
- Chaikin Money Flow (CMF): The CMF has been negative, suggesting a slight distribution phase.
Key Observation: Volume indicators show a lack of strong buying or selling pressure.
Conclusion:
Based on the analysis of technical indicators: - Trend: Bullish in both short and mid to long term. - Momentum: Slightly bearish with potential for a reversal. - Volatility: Consolidation phase with a potential breakout. - Volume: Neutral with balanced buying and selling pressure.
Future Price Movement Prediction:
Considering the bullish trend, potential reversal in momentum, consolidation in volatility, and neutral volume, the next few days may see upward price movement with the possibility of a short-term correction due to the overbought stochastic levels. Traders should watch for a breakout above the upper Bollinger Band as a confirmation of the bullish trend.