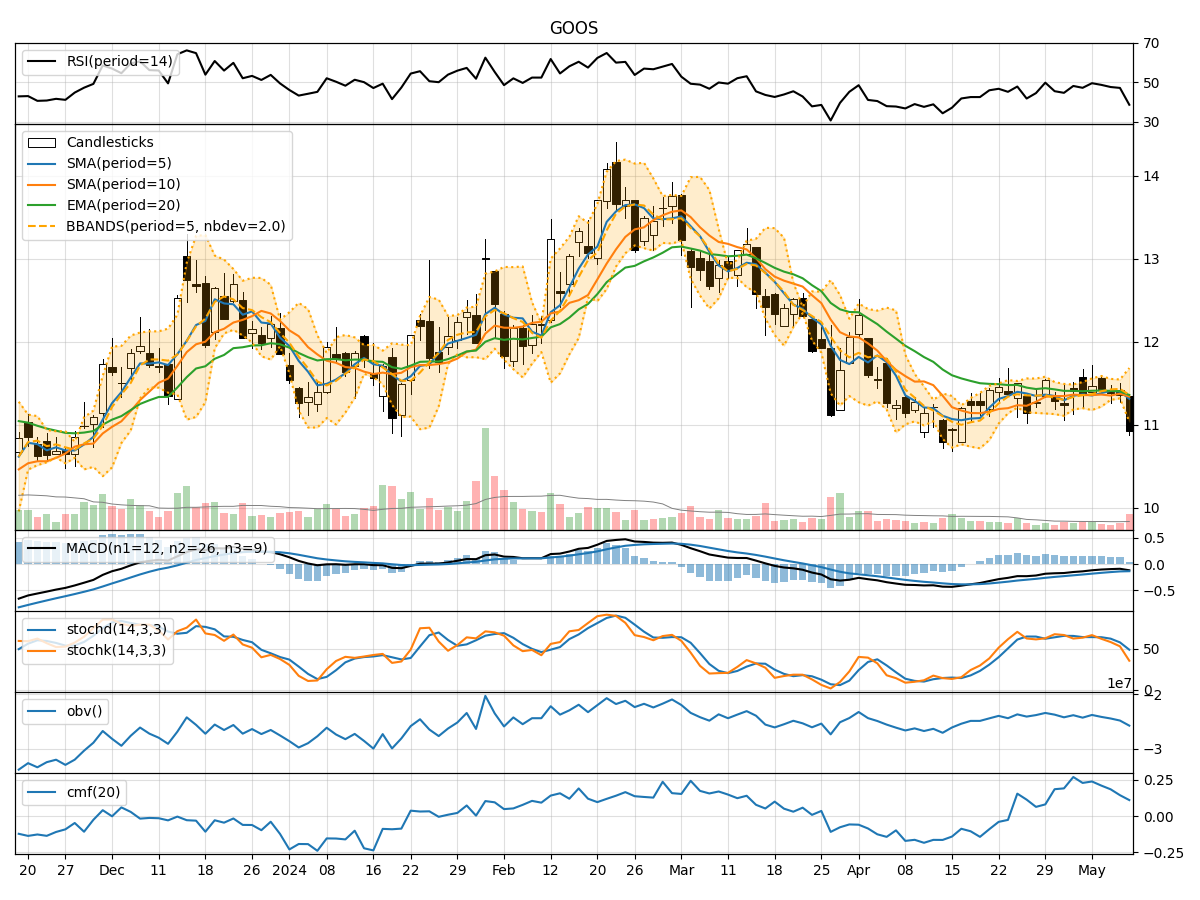
Technical Analysis of GOOS 2024-05-10
Overview:
In analyzing the technical indicators for GOOS over the last 5 days, we will delve into the trend, momentum, volatility, and volume indicators to provide a comprehensive outlook on the possible stock price movement in the coming days.
Trend Analysis:
- Moving Averages (MA): The 5-day Moving Average (MA) has been declining, indicating a short-term bearish trend.
- MACD: The MACD line has been consistently below the signal line, suggesting a bearish momentum.
- EMA: The Exponential Moving Average (EMA) has also been trending downwards, aligning with the bearish sentiment.
Momentum Analysis:
- RSI: The Relative Strength Index (RSI) has been decreasing, indicating weakening momentum.
- Stochastic Oscillator: Both %K and %D have been declining, signaling a bearish momentum.
- Williams %R: The indicator has been in oversold territory, suggesting a potential reversal.
Volatility Analysis:
- Bollinger Bands (BB): The stock price has breached the lower Bollinger Band, indicating increased volatility and a possible oversold condition.
- Bollinger Band Width: The Band Width has widened, reflecting heightened volatility in the stock.
Volume Analysis:
- On-Balance Volume (OBV): The OBV has been fluctuating, suggesting indecision among investors.
- Chaikin Money Flow (CMF): The CMF has been positive but decreasing, indicating a potential outflow of money from the stock.
Key Observations and Opinions:
- Trend: The trend indicators point towards a downward trajectory in the stock price.
- Momentum: Momentum indicators suggest a bearish sentiment with potential for a reversal due to oversold conditions.
- Volatility: Increased volatility is evident, with the stock potentially being oversold.
- Volume: Volume indicators show mixed signals, reflecting uncertainty among market participants.
Conclusion:
Based on the analysis of the technical indicators, the next few days for GOOS are likely to see further downward movement in the stock price. Investors should exercise caution as the stock is currently in oversold territory, which could lead to a potential reversal in the near term. It is advisable to closely monitor key support levels and wait for confirmation of a trend reversal before considering any bullish positions.