Technical Analysis of GPOR 2024-05-10
Overview:
In analyzing the technical indicators for GPOR over the last 5 days, we will delve into the trend, momentum, volatility, and volume indicators to provide a comprehensive outlook on the possible stock price movement in the coming days.
Trend Analysis:
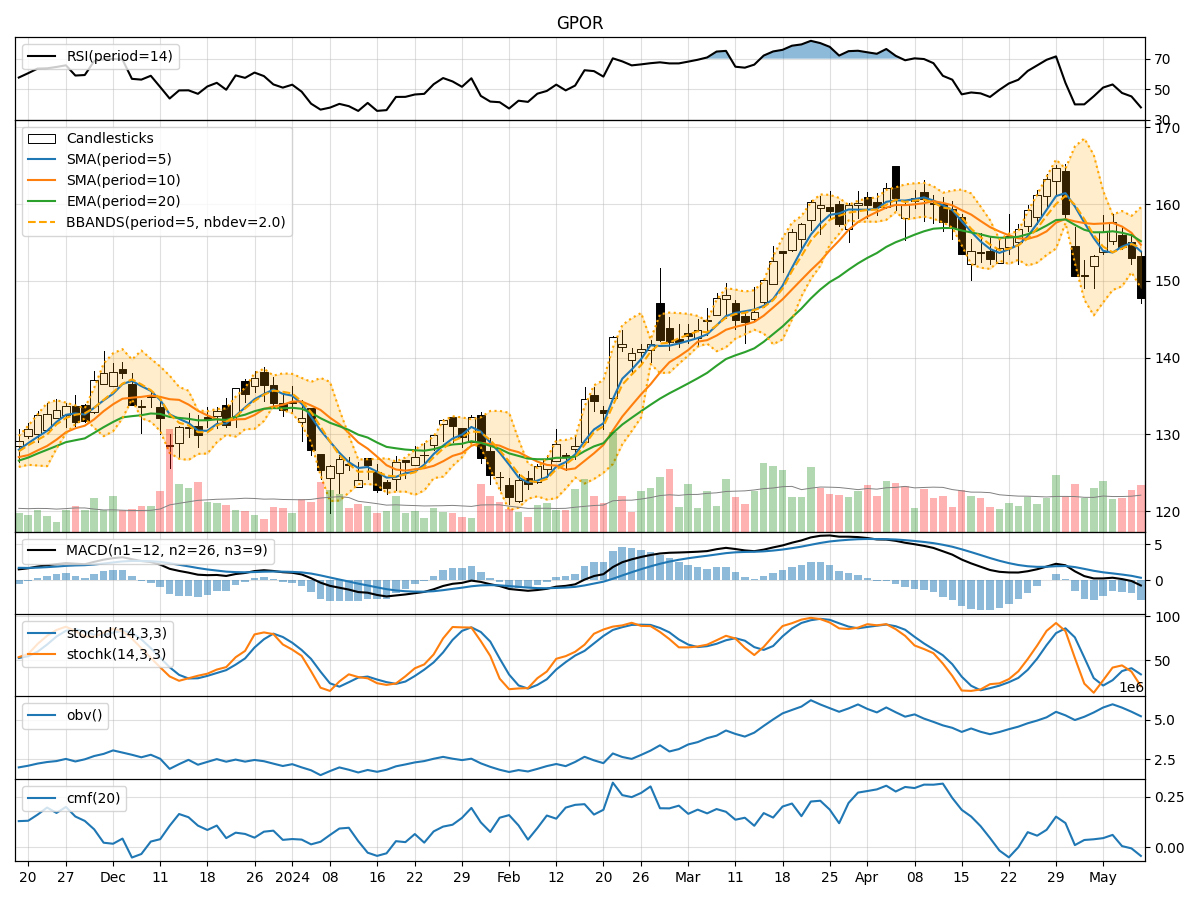
- Moving Averages (MA): The 5-day Moving Average (MA) has been fluctuating around the 10-day Simple Moving Average (SMA) and 20-day Exponential Moving Average (EMA), indicating a lack of clear trend direction.
- MACD: The Moving Average Convergence Divergence (MACD) has been negative, with the MACD line consistently below the signal line, suggesting a bearish trend.
Momentum Analysis:
- RSI: The Relative Strength Index (RSI) has been hovering around the 50 level, indicating a neutral momentum in the stock.
- Stochastic Oscillator: Both %K and %D of the Stochastic Oscillator have been in oversold territory, signaling a potential reversal in the stock's momentum.
Volatility Analysis:
- Bollinger Bands (BB): The Bollinger Bands have been narrowing, indicating decreasing volatility in the stock price.
Volume Analysis:
- On-Balance Volume (OBV): The OBV has been declining, suggesting that selling pressure has been increasing in the stock.
- Chaikin Money Flow (CMF): The CMF has been relatively flat, indicating a balance between buying and selling pressure.
Key Observations:
- The stock is currently in a bearish trend based on the negative MACD and lack of clear trend direction in moving averages.
- Momentum indicators suggest a neutral to slightly bearish sentiment with RSI around 50 and Stochastic Oscillator in oversold territory.
- Volatility has been decreasing, indicating a potential period of consolidation or sideways movement.
- The declining OBV and flat CMF signal increasing selling pressure and a lack of strong buying interest.
Conclusion:
Based on the analysis of technical indicators, the next few days for GPOR are likely to see further downside movement or consolidation. The bearish trend indicated by the MACD, coupled with neutral to bearish momentum signals, suggests that the stock may face continued selling pressure. Traders should exercise caution and consider waiting for clearer signals before making any significant trading decisions.