Technical Analysis of GPRK 2024-05-10
Overview:
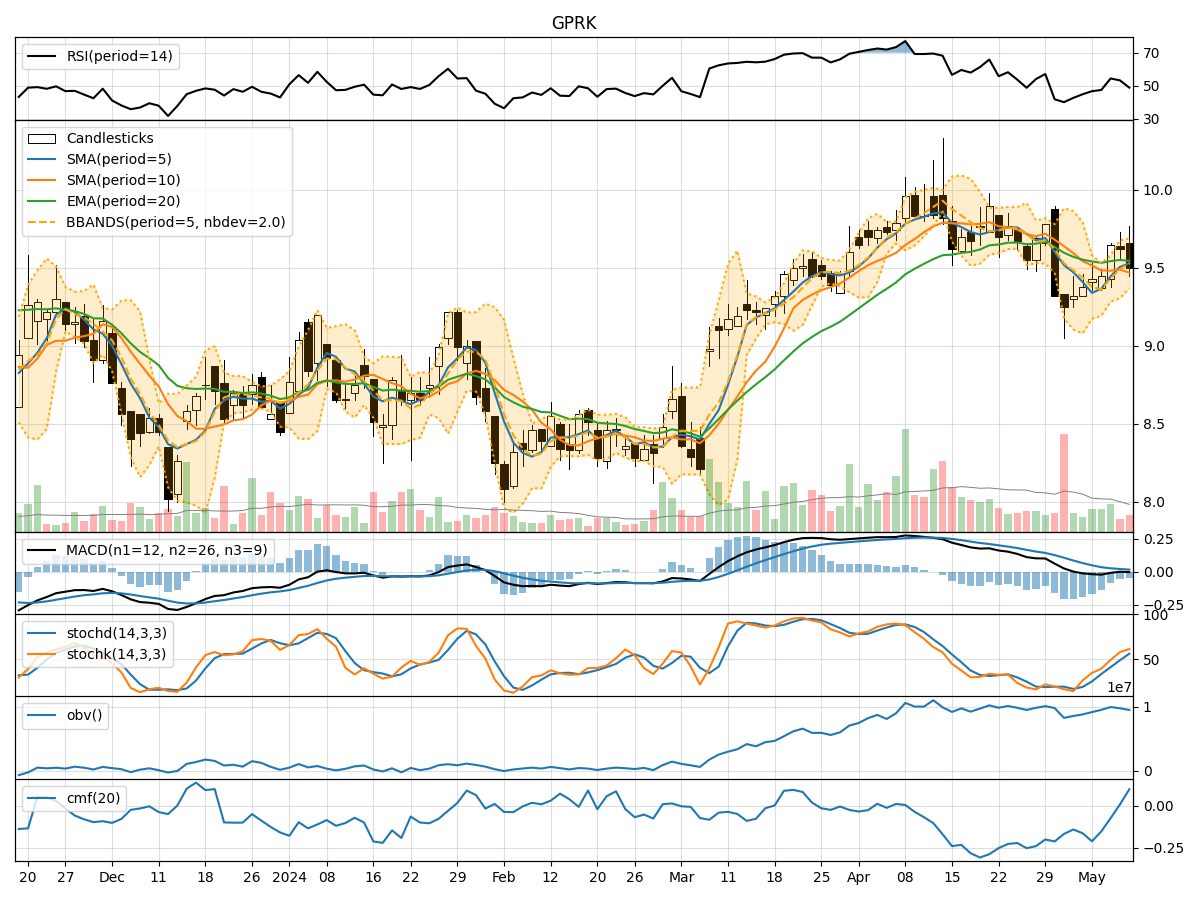
In analyzing the technical indicators for GPRK over the last 5 days, we will delve into the trend, momentum, volatility, and volume indicators to provide a comprehensive outlook on the possible stock price movement in the coming days.
Trend Analysis:
- Moving Averages (MA): The 5-day Moving Average (MA) has been fluctuating around the closing prices, indicating short-term price trends.
- MACD: The Moving Average Convergence Divergence (MACD) has shown a slight positive trend, with the MACD line crossing above the signal line on some days.
Momentum Analysis:
- RSI: The Relative Strength Index (RSI) has been hovering around the mid-range, suggesting a balanced momentum in the stock.
- Stochastic Oscillator: The Stochastic Oscillator indicates that the stock has been in the overbought territory on some days, potentially signaling a reversal.
Volatility Analysis:
- Bollinger Bands (BB): The Bollinger Bands have shown narrowing bands, indicating decreasing volatility in the stock price.
- Average True Range (ATR): The ATR values have been relatively stable, suggesting consistent price movements.
Volume Analysis:
- On-Balance Volume (OBV): The OBV has shown mixed signals, with fluctuations in volume accumulation.
- Chaikin Money Flow (CMF): The CMF has been negative, indicating potential selling pressure in the stock.
Key Observations:
- The stock has been trading within a narrow range, with limited price movements.
- Momentum indicators suggest a neutral stance, with no clear trend in either direction.
- Volatility has been decreasing, indicating a possible period of consolidation.
- Volume indicators show mixed signals, reflecting uncertainty among market participants.
Conclusion:
Based on the analysis of the technical indicators, the stock is likely to experience further consolidation in the coming days. The lack of strong trends in both momentum and volume, coupled with decreasing volatility, suggests a period of sideways movement. Traders may expect the stock price to remain range-bound without significant upward or downward movements. It is advisable to closely monitor key support and resistance levels for potential breakout opportunities in the future.