Technical Analysis of GPS 2024-05-10
Overview:
In analyzing the technical indicators for GPS stock over the last 5 days, we will delve into the trend, momentum, volatility, and volume indicators to provide a comprehensive outlook on the possible stock price movement. By examining these key factors, we aim to offer valuable insights and predictions for the upcoming trading days.
Trend Analysis:
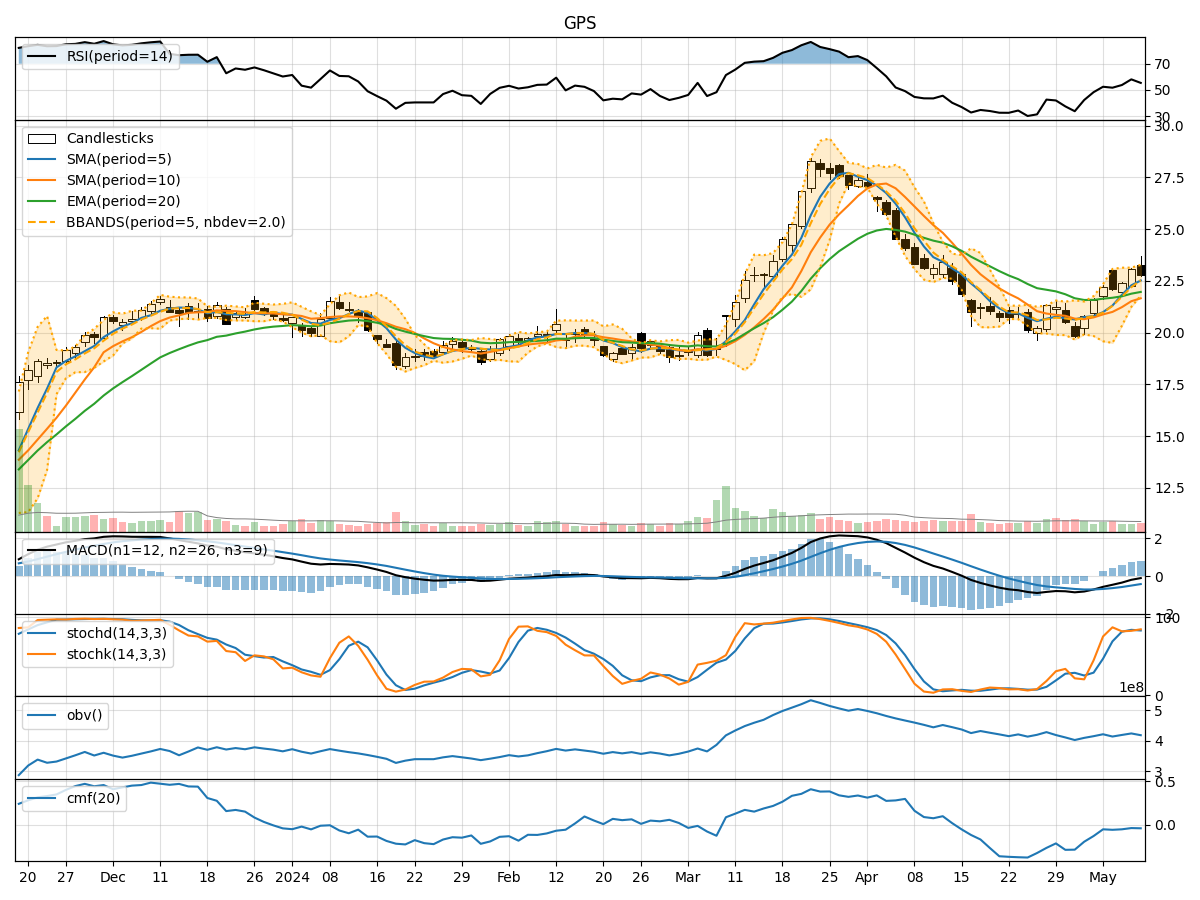
- Moving Averages (MA): The 5-day Moving Average (MA) has been showing an upward trend, indicating a positive momentum in the stock price.
- MACD: The Moving Average Convergence Divergence (MACD) has been consistently negative but showing signs of convergence towards the signal line, suggesting a potential reversal in the bearish trend.
- RSI: The Relative Strength Index (RSI) has been fluctuating around the neutral zone, indicating a balanced momentum in the stock.
Momentum Analysis:
- Stochastic Oscillator: The Stochastic Oscillator is hovering in the overbought territory, suggesting a potential reversal or consolidation in the stock price.
- Williams %R: The Williams %R indicator is in the oversold region, indicating a possible buying opportunity for traders.
Volatility Analysis:
- Bollinger Bands: The Bollinger Bands are narrowing, indicating decreasing volatility in the stock price. This could precede a period of consolidation or a breakout in either direction.
Volume Analysis:
- On-Balance Volume (OBV): The OBV indicator has been fluctuating, suggesting indecision among market participants regarding the stock's direction.
- Chaikin Money Flow (CMF): The CMF is negative, indicating a bearish money flow in the stock.
Key Observations:
- The stock is currently in a consolidation phase, as indicated by the narrowing Bollinger Bands and the mixed signals from the momentum indicators.
- The trend indicators show a potential reversal in the bearish trend, supported by the positive divergence in the MACD.
- The volume indicators suggest a lack of strong conviction among investors, leading to indecision in the market sentiment.
Conclusion:
Based on the analysis of the technical indicators, the next few days for GPS stock are likely to see sideways movement with a slight upward bias. Traders should exercise caution and wait for clearer signals from the indicators before taking significant positions. The stock may experience some volatility in the short term, but the overall trend is expected to remain neutral to slightly bullish. It is advisable to closely monitor the price action and key support/resistance levels for potential trading opportunities.