Technical Analysis of GRC 2024-05-10
Overview:
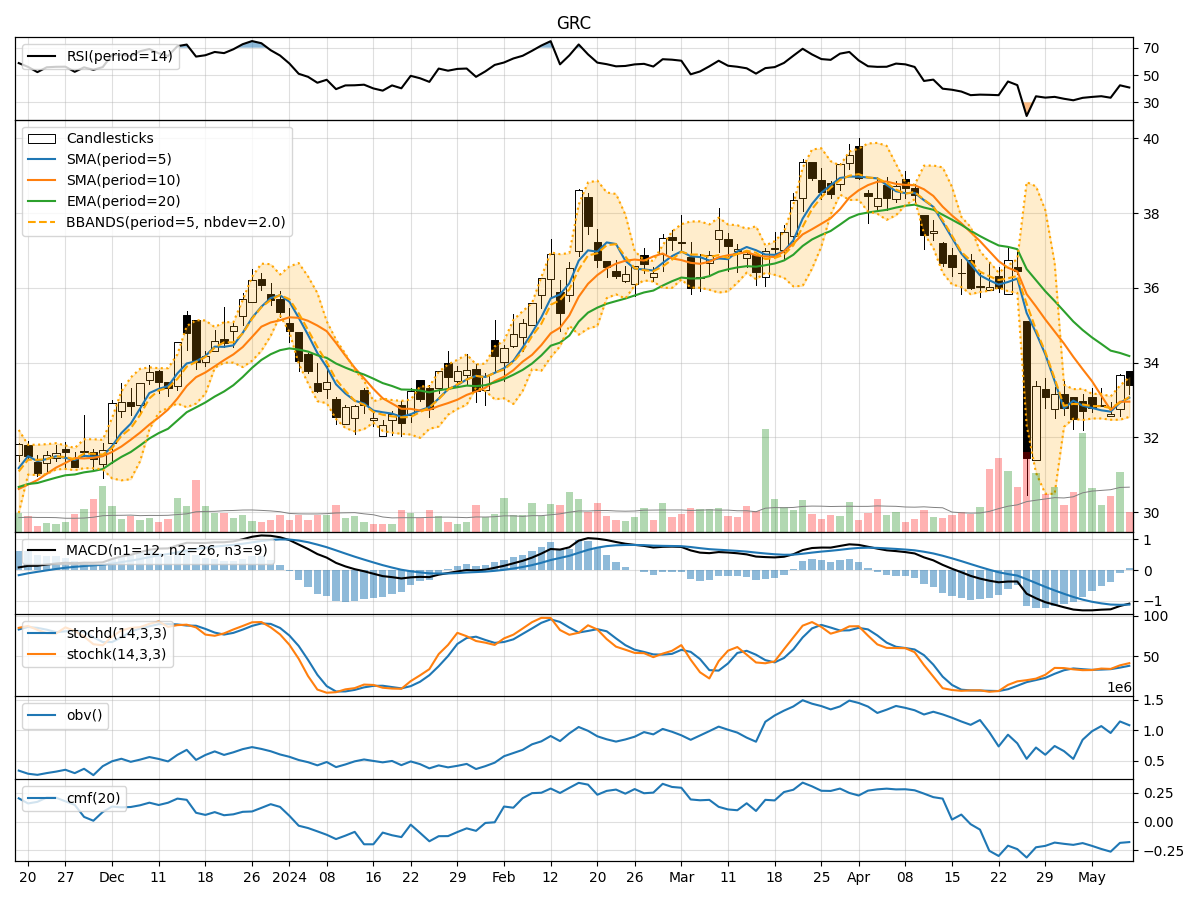
In analyzing the technical indicators for GRC over the last 5 days, we will delve into the trend, momentum, volatility, and volume indicators to provide a comprehensive outlook on the possible stock price movement in the coming days. By examining these key indicators, we aim to offer valuable insights and predictions for informed decision-making.
Trend Analysis:
- Moving Averages (MA): The 5-day MA has been fluctuating around the closing prices, indicating short-term price trends. The SMA(10) and EMA(20) show a downward trend, suggesting a bearish sentiment in the medium to long term.
- MACD: The MACD line has been consistently below the signal line, indicating a bearish trend in the stock price movement.
- RSI: The RSI values have been relatively low, indicating a potential oversold condition in the stock.
Momentum Analysis:
- Stochastic Oscillator: The Stochastic Oscillator shows mixed signals with fluctuations in the %K and %D values, suggesting indecision in the momentum.
- Williams %R (WillR): The Williams %R values have been hovering in the oversold territory, indicating a potential reversal or consolidation phase.
Volatility Analysis:
- Bollinger Bands (BB): The Bollinger Bands have widened, indicating increased volatility in the stock price. The current price is closer to the lower band, suggesting a possible oversold condition.
- BB% (BB Percentage): The BB% values indicate that the stock price is nearing the lower band, signaling a potential bounce or reversal.
Volume Analysis:
- On-Balance Volume (OBV): The OBV values have shown mixed trends, indicating uncertainty in the buying and selling pressure.
- Chaikin Money Flow (CMF): The CMF values have been negative, suggesting a bearish money flow in the stock.
Conclusion:
Based on the analysis of the technical indicators, the stock of GRC is currently in a bearish phase with downward trends in moving averages, MACD signals, and RSI indicating potential oversold conditions. The momentum indicators show mixed signals, with the Williams %R nearing oversold levels, suggesting a possible reversal or consolidation. The volatility indicators point towards increased volatility and a potential bounce from the lower Bollinger Band. The volume indicators reflect uncertainty in buying and selling pressure.
Recommendation:
Considering the overall technical analysis, it is advisable to exercise caution in trading GRC in the coming days. Traders should closely monitor key support levels and wait for confirmation of a trend reversal before considering long positions. Short-term traders may find opportunities in potential bounces from oversold conditions, while long-term investors should wait for more stable price action before entering or adding to positions.