Technical Analysis of GSBD 2024-05-10
Overview:
In analyzing the technical indicators for GSBD over the last 5 days, we will delve into the trend, momentum, volatility, and volume indicators to provide a comprehensive outlook on the possible stock price movement in the coming days.
Trend Analysis:
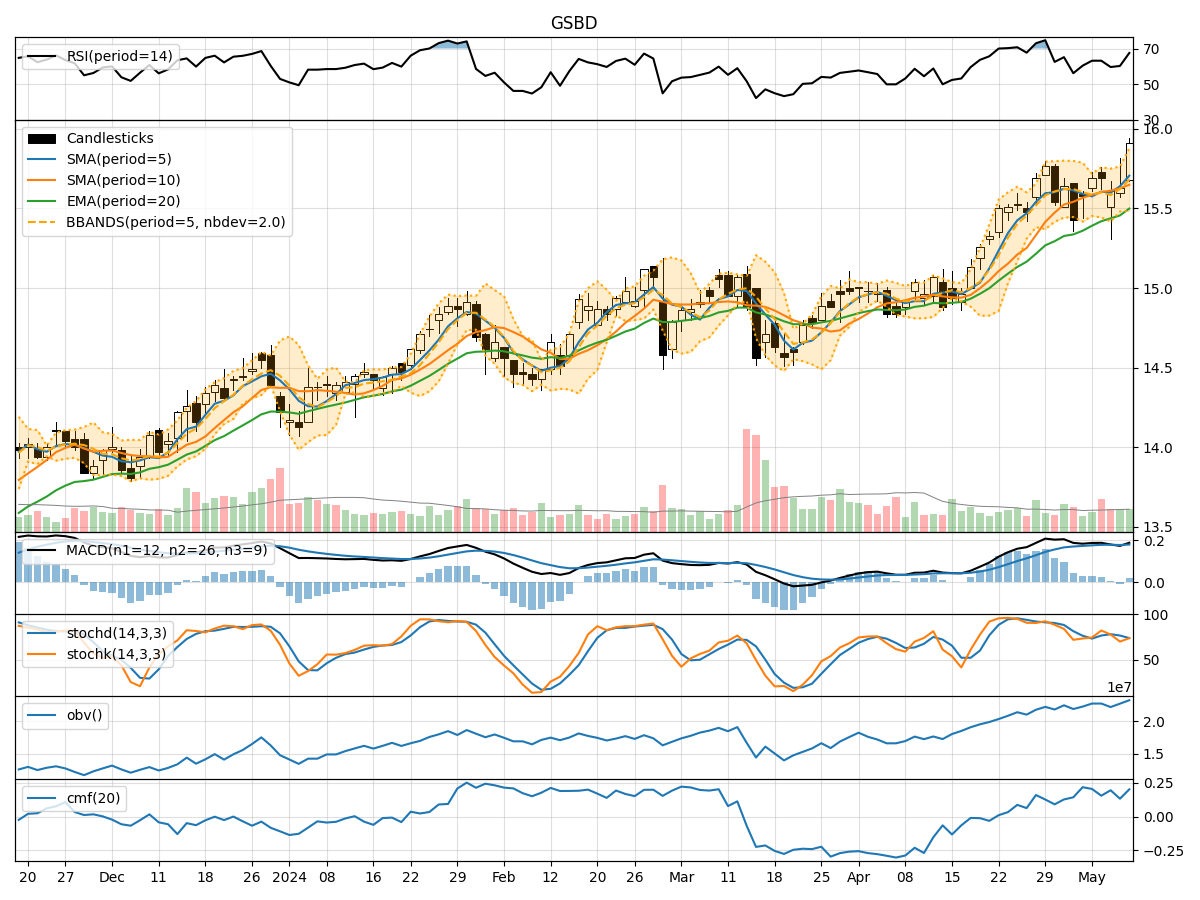
- Moving Averages (MA): The 5-day Moving Average (MA) has been showing an upward trend, indicating a positive momentum in the stock price.
- MACD: The MACD line has been consistently above the signal line, suggesting a bullish trend in the stock.
- RSI: The Relative Strength Index (RSI) has been fluctuating but generally staying within the neutral to slightly overbought territory.
Momentum Analysis:
- Stochastic Oscillator: The Stochastic Oscillator has been fluctuating but is currently in the neutral zone, indicating potential for a shift in momentum.
- Williams %R: The Williams %R is currently in the oversold territory, suggesting a possible reversal in the stock price.
Volatility Analysis:
- Bollinger Bands: The Bollinger Bands have been widening, indicating increased volatility in the stock price.
- Average True Range (ATR): The ATR has shown fluctuations but has not indicated any significant trend in volatility.
Volume Analysis:
- On-Balance Volume (OBV): The OBV has shown mixed signals, with no clear trend in volume accumulation or distribution.
- Chaikin Money Flow (CMF): The CMF has been fluctuating around the zero line, indicating a balance between buying and selling pressure.
Key Observations:
- The stock has shown a positive trend based on moving averages and MACD.
- Momentum indicators suggest a potential shift in momentum.
- Volatility has increased, as indicated by widening Bollinger Bands.
- Volume indicators show mixed signals with no clear trend in volume accumulation.
Conclusion:
Based on the analysis of the technical indicators, the stock is likely to experience a bullish movement in the coming days. The positive trend indicated by moving averages and MACD, coupled with the potential reversal in momentum suggested by Williams %R, point towards a favorable outlook for GSBD. However, the increased volatility as shown by Bollinger Bands warrants caution, and investors should closely monitor the stock for any sudden price fluctuations.