Technical Analysis of GSK 2024-05-10
Overview:
In analyzing the technical indicators for GSK over the last 5 days, we will delve into the trend, momentum, volatility, and volume indicators to provide a comprehensive outlook on the possible stock price movement in the coming days. By examining these key aspects, we aim to offer valuable insights and predictions to guide your investment decisions.
Trend Analysis:
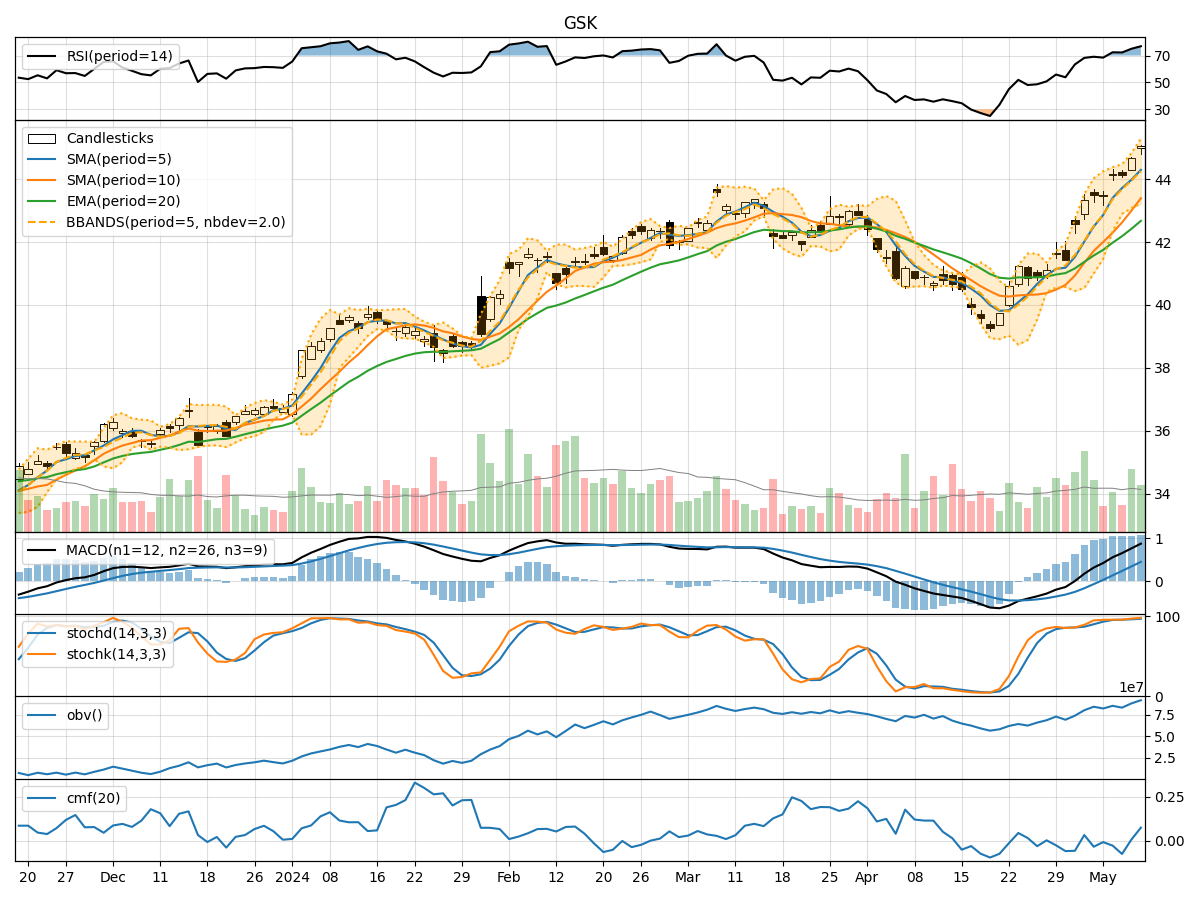
- Moving Averages (MA): The 5-day Moving Average has been consistently rising, indicating a bullish trend in the short term.
- MACD: The MACD line has been increasing, crossing above the signal line, suggesting a strengthening bullish momentum.
- RSI: The Relative Strength Index has been trending upwards, reaching overbought levels, signaling a potential reversal or consolidation.
Momentum Analysis:
- Stochastic Oscillator: Both %K and %D lines are in the overbought zone, indicating a potential reversal or pullback.
- Williams %R: The Williams %R is in the oversold territory, suggesting a possible buying opportunity.
Volatility Analysis:
- Bollinger Bands: The price has been trading near the upper Bollinger Band, indicating an overbought condition and a potential reversal.
- Volatility: The volatility has been increasing, which may lead to larger price swings in the near future.
Volume Analysis:
- On-Balance Volume (OBV): The OBV has been trending upwards, indicating accumulation by investors.
- Chaikin Money Flow (CMF): The CMF has been negative, suggesting selling pressure in the market.
Key Observations:
- The trend indicators suggest a bullish sentiment in the short term.
- Momentum indicators show conflicting signals with overbought and oversold conditions.
- Volatility is increasing, indicating potential price swings.
- Volume indicators point towards accumulation but with some selling pressure.
Conclusion:
Based on the analysis of the technical indicators, the next few days' possible stock price movement for GSK could be sideways to slightly bearish. The conflicting signals from momentum indicators and the overbought conditions suggest a potential pullback or consolidation. The increasing volatility may lead to larger price swings, while the volume indicators indicate a mix of accumulation and selling pressure. It is advisable to closely monitor the price action and key support levels for potential entry or exit points in the coming days.