Technical Analysis of GTES 2024-05-10
Overview:
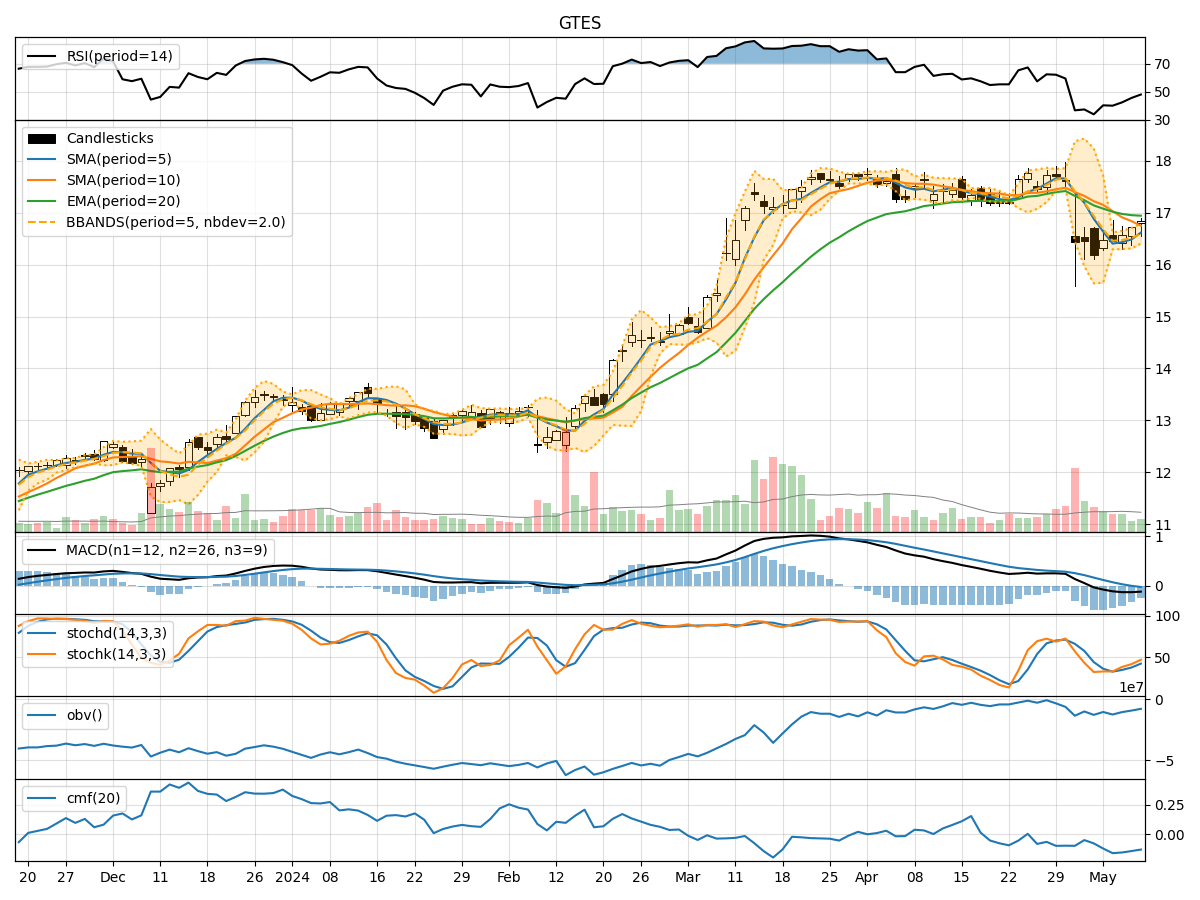
In analyzing the technical indicators for GTES over the last 5 days, we will delve into the trend, momentum, volatility, and volume indicators to provide a comprehensive assessment of the stock's potential price movement. By examining these key factors, we aim to offer valuable insights and predictions for the next few days.
Trend Analysis:
- Moving Averages (MA): The 5-day Moving Average (MA) has been fluctuating around the closing prices, indicating short-term price trends. The Simple Moving Average (SMA) and Exponential Moving Average (EMA) show a downward trend, with the EMA slightly below the SMA.
- MACD: The Moving Average Convergence Divergence (MACD) has been negative, suggesting a bearish momentum in the stock price.
- Conclusion: The trend indicators point towards a downward trend in the stock price.
Momentum Analysis:
- RSI: The Relative Strength Index (RSI) has been increasing, indicating a potential reversal in the stock's momentum.
- Stochastic Oscillator: Both %K and %D have been rising, suggesting an increase in buying pressure.
- Conclusion: The momentum indicators suggest a potential reversal in the stock's momentum towards the upside.
Volatility Analysis:
- Bollinger Bands (BB): The Bollinger Bands have been narrowing, indicating decreasing volatility in the stock price.
- Conclusion: The volatility indicators suggest a decrease in price volatility, potentially leading to a period of consolidation.
Volume Analysis:
- On-Balance Volume (OBV): The OBV has been fluctuating, indicating mixed buying and selling pressure.
- Chaikin Money Flow (CMF): The CMF has been negative, suggesting a lack of buying pressure.
- Conclusion: The volume indicators show mixed signals with no clear direction in buying or selling pressure.
Overall Conclusion:
Based on the analysis of the technical indicators, the next few days' possible stock price movement for GTES is likely to be sideways with a slight upward bias. While the trend indicators point towards a downward trend, the momentum indicators suggest a potential reversal in momentum towards the upside. The decrease in volatility indicates a period of consolidation, while the volume indicators show mixed signals with no clear direction in buying or selling pressure.
Recommendation:
Considering the mixed signals from the technical indicators, it is advisable for traders to exercise caution and closely monitor the stock's price action in the coming days. It would be prudent to wait for more confirmatory signals before making any significant trading decisions.