Technical Analysis of GWRE 2024-05-10
Overview:
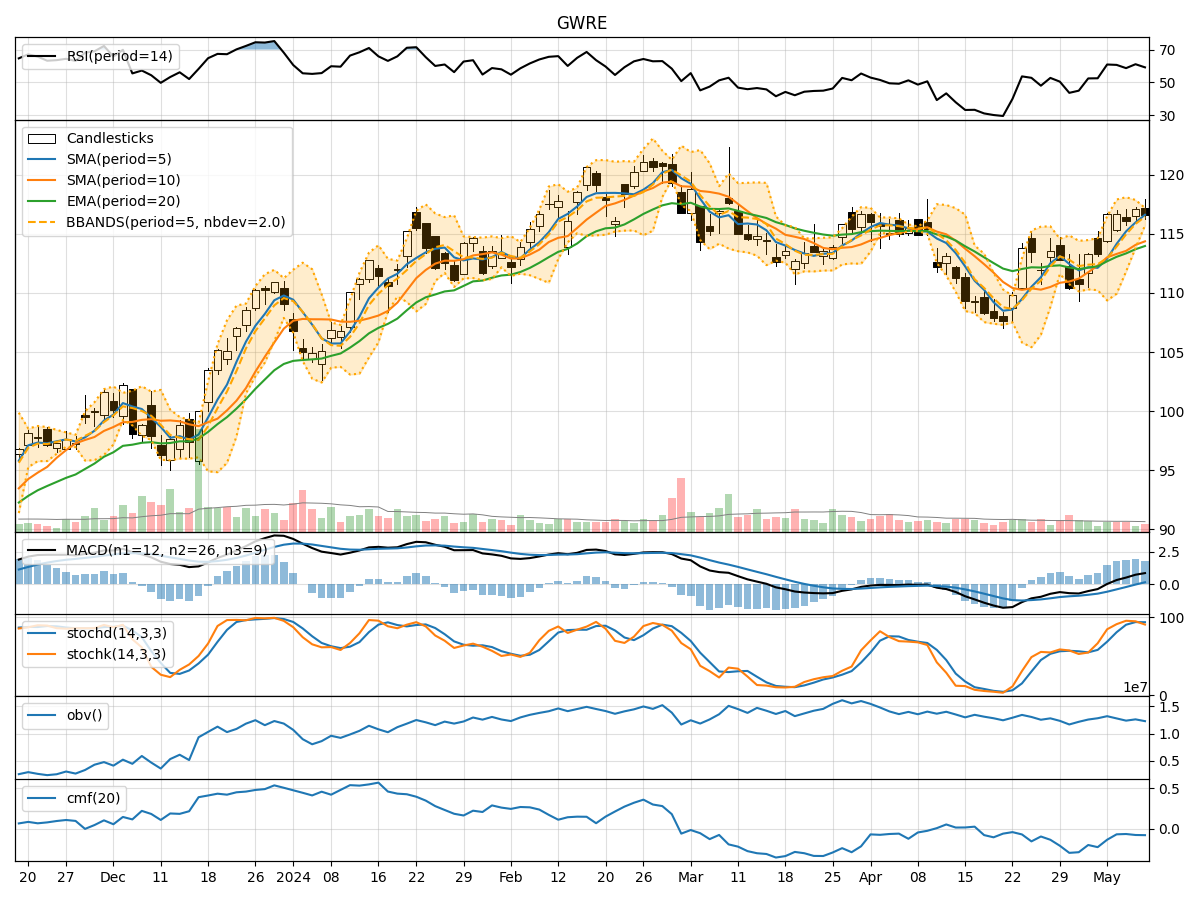
In analyzing the technical indicators for GWRE over the last 5 days, we will delve into the trend, momentum, volatility, and volume indicators to provide a comprehensive outlook on the possible stock price movement. By examining these key factors, we aim to offer valuable insights and predictions for the upcoming days.
Trend Indicators:
- Moving Averages (MA): The 5-day Moving Average (MA) has been consistently above the Simple Moving Average (SMA) and Exponential Moving Average (EMA), indicating a bullish trend.
- MACD: The Moving Average Convergence Divergence (MACD) has shown positive values, with the MACD line consistently above the signal line, suggesting bullish momentum.
- MACD Histogram: The MACD Histogram has been mostly positive, indicating increasing bullish momentum.
Momentum Indicators:
- RSI: The Relative Strength Index (RSI) has been fluctuating around the 60-61 range, indicating a neutral momentum.
- Stochastic Oscillator: Both %K and %D of the Stochastic Oscillator have been relatively high, suggesting overbought conditions.
- Williams %R: The Williams %R has been consistently in the oversold territory, indicating a potential reversal.
Volatility Indicators:
- Bollinger Bands: The Bollinger Bands have shown narrowing bands, indicating decreasing volatility.
- Bollinger %B: The %B indicator has been hovering around the middle range, suggesting a neutral stance on volatility.
Volume Indicators:
- On-Balance Volume (OBV): The OBV has shown a declining trend, indicating selling pressure.
- Chaikin Money Flow (CMF): The CMF has been negative, suggesting outflow of money from the stock.
Key Observations:
- The trend indicators suggest a bullish sentiment with positive moving averages and MACD values.
- Momentum indicators show mixed signals with RSI in a neutral zone and Stochastic Oscillator indicating overbought conditions.
- Volatility indicators point towards decreasing volatility, potentially leading to a consolidation phase.
- Volume indicators reflect selling pressure with a negative OBV and CMF.
Conclusion:
Based on the analysis of the technical indicators, the next few days for GWRE could see sideways movement or consolidation as the stock may enter a period of indecision. The bullish trend indicated by moving averages and MACD could be offset by the overbought conditions highlighted by the Stochastic Oscillator. Decreasing volatility and negative volume indicators further support the view of a potential consolidation phase. Traders should exercise caution and closely monitor key levels for potential breakout or breakdown scenarios.