Technical Analysis of GXO 2024-05-10
Overview:
In analyzing the technical indicators for GXO over the last 5 days, we will delve into the trend, momentum, volatility, and volume indicators to provide a comprehensive outlook on the possible stock price movement. By examining these key aspects, we aim to offer valuable insights and predictions for the upcoming days.
Trend Analysis:
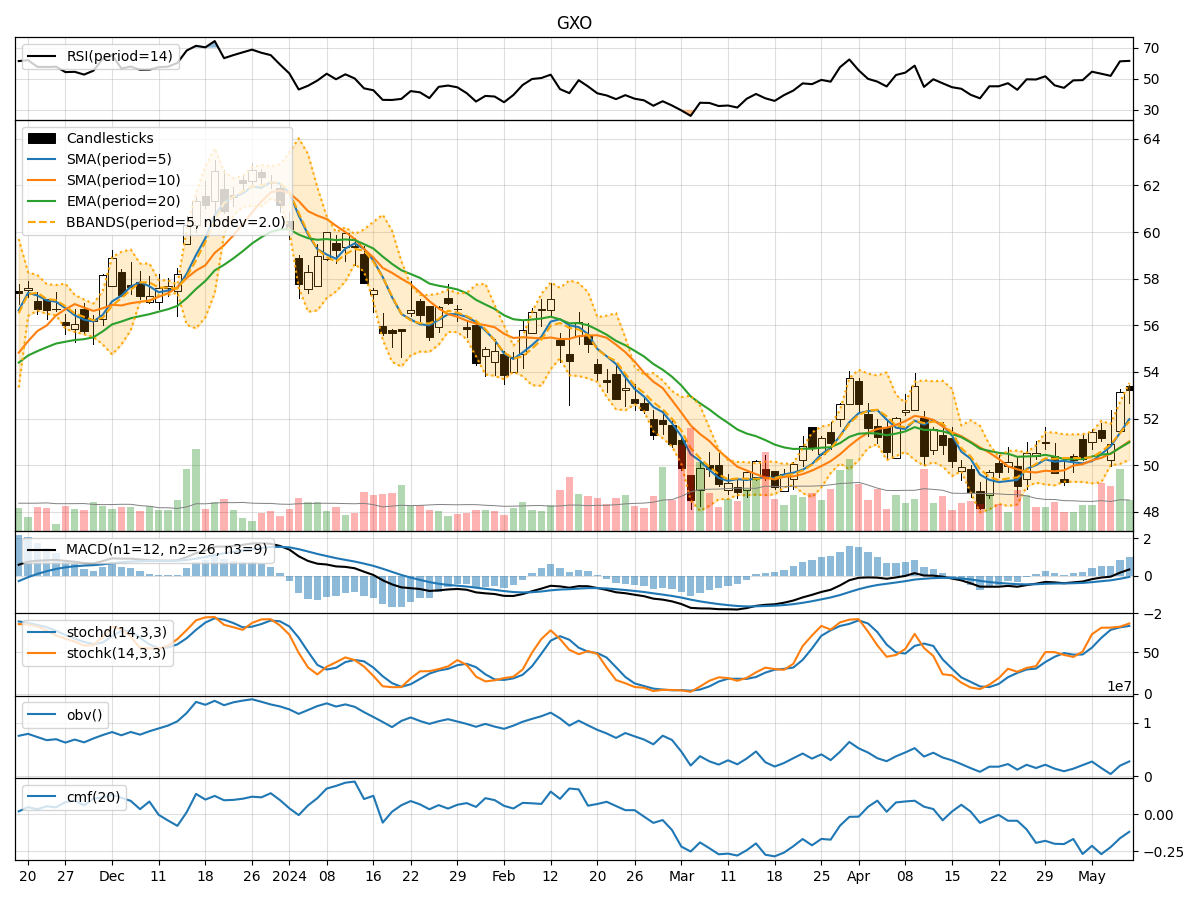
- Moving Averages (MA): The 5-day Moving Average (MA) has been trending upwards, indicating a positive momentum in the stock price.
- MACD: The Moving Average Convergence Divergence (MACD) has shown an increasing trend, with the MACD line consistently above the signal line, suggesting a bullish momentum.
- RSI: The Relative Strength Index (RSI) has been fluctuating but generally in the overbought territory, indicating a strong bullish sentiment.
Momentum Analysis:
- Stochastic Oscillator: Both %K and %D values of the Stochastic Oscillator have been in the overbought zone, suggesting a potential reversal or consolidation.
- Williams %R: The Williams %R indicator has been hovering in the oversold region, indicating a potential buying opportunity.
Volatility Analysis:
- Bollinger Bands: The Bollinger Bands have been widening, indicating increased volatility in the stock price.
- Average True Range (ATR): The ATR has shown an uptrend, signifying an increase in price volatility.
Volume Analysis:
- On-Balance Volume (OBV): The OBV has been fluctuating but generally on a downtrend, suggesting some distribution happening in the stock.
- Chaikin Money Flow (CMF): The CMF has been negative, indicating selling pressure in the stock.
Key Observations:
- The trend indicators suggest a bullish sentiment with positive moving averages and MACD.
- Momentum indicators show a potential overbought condition, signaling a need for caution.
- Volatility indicators point towards increasing price fluctuations.
- Volume indicators indicate a slight distribution phase with negative OBV and CMF values.
Conclusion:
Based on the analysis of the technical indicators, the next few days for GXO stock price movement could see further upside potential but with a possibility of a short-term correction due to the overbought conditions indicated by momentum indicators. Investors should closely monitor the price action for any signs of reversal or consolidation. Exercise caution in entering new positions and consider taking profits if the stock price continues to rise.