Technical Analysis of HBM 2024-05-10
Overview:
In analyzing the technical indicators for HBM stock over the last 5 days, we will delve into the trend, momentum, volatility, and volume indicators to provide a comprehensive outlook on the possible future stock price movement. By examining these key indicators, we aim to offer valuable insights and recommendations for potential investors.
Trend Analysis:
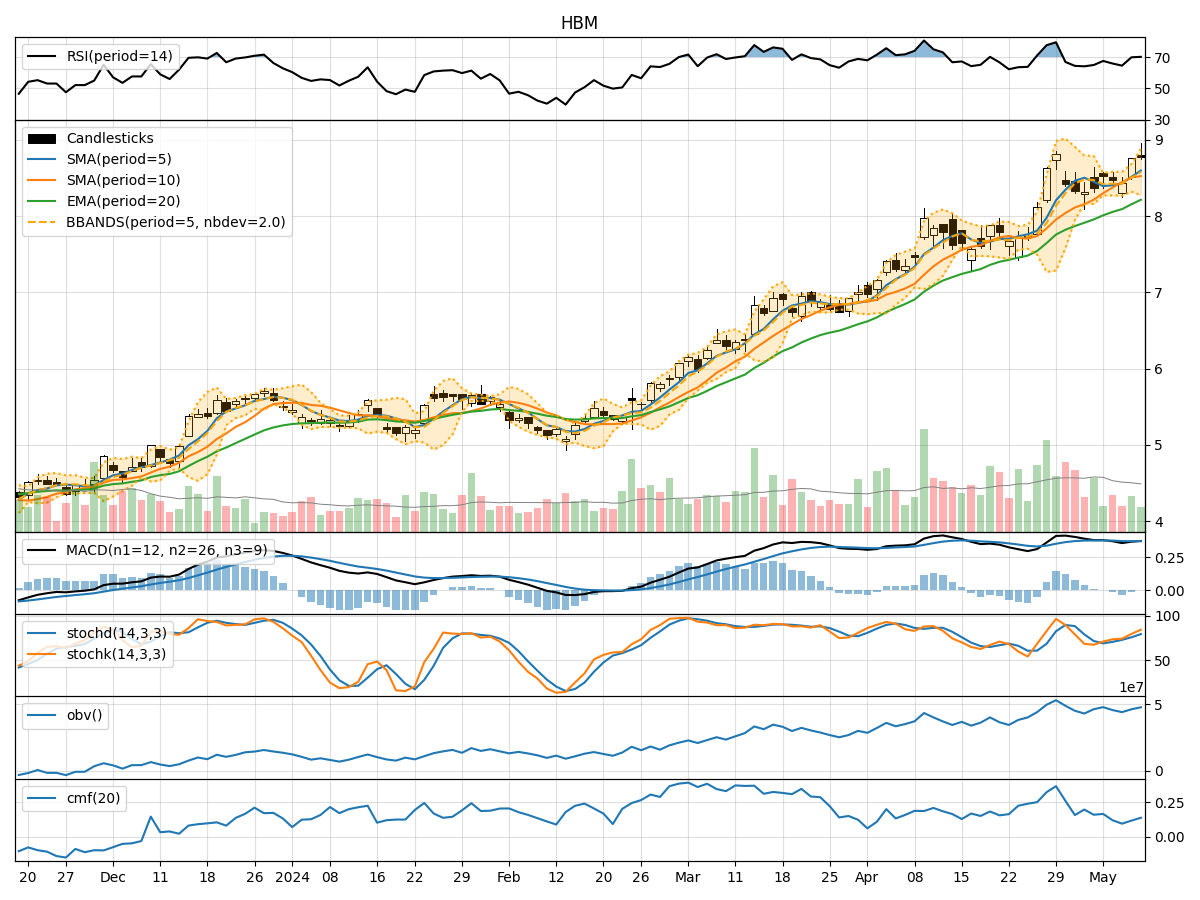
- Moving Averages (MA): The 5-day Moving Average (MA) has been consistently above the Simple Moving Average (SMA) and Exponential Moving Average (EMA), indicating a bullish trend.
- MACD: The MACD line has been positive, staying above the signal line, suggesting upward momentum in the stock price.
- RSI: The Relative Strength Index (RSI) has been fluctuating around the overbought territory, indicating strong buying momentum.
Momentum Analysis:
- Stochastic Oscillator: Both %K and %D lines of the Stochastic Oscillator have been in the overbought zone, signaling a strong bullish momentum.
- Williams %R: The Williams %R indicator has been consistently in the oversold region, suggesting a potential reversal in the stock price.
Volatility Analysis:
- Bollinger Bands (BB): The stock price has been trading within the upper Bollinger Band, indicating high volatility and a potential continuation of the uptrend.
- BB% (Bollinger Band %B): The BB% has been fluctuating, suggesting potential price reversals or breakouts.
Volume Analysis:
- On-Balance Volume (OBV): The OBV indicator has been showing an overall increase, indicating strong buying pressure in the stock.
- Chaikin Money Flow (CMF): The CMF has been positive, reflecting a bullish money flow into the stock.
Conclusion:
Based on the analysis of the technical indicators, the stock is likely to continue its upward momentum in the next few days. The trend indicators, momentum oscillators, volatility bands, and volume indicators all point towards a bullish outlook. Investors may consider buying or holding positions in HBM stock for potential gains. It is essential to monitor the indicators closely for any signs of reversal or consolidation in the future.