Technical Analysis of HE 2024-05-10
Overview:
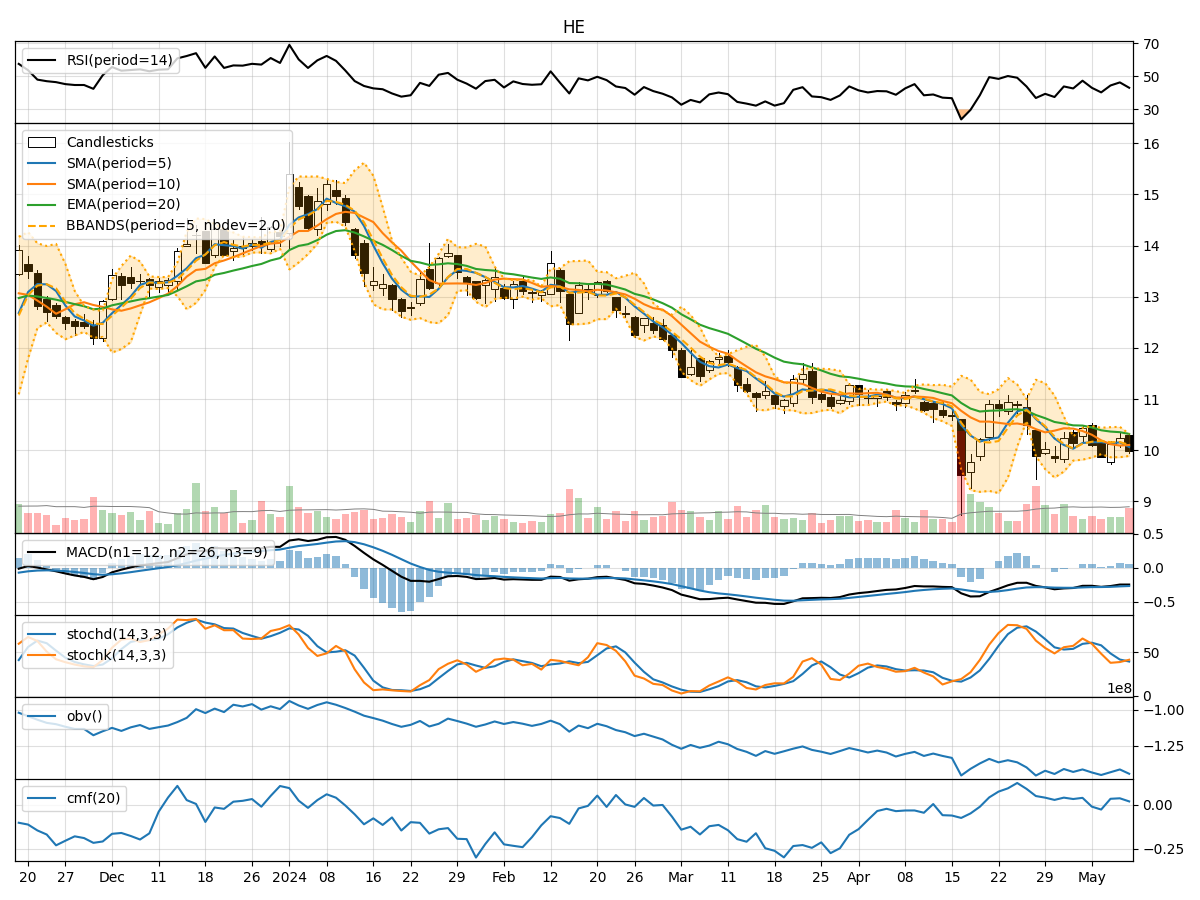
In analyzing the technical indicators for the stock over the last 5 days, we will delve into the trends, momentum, volatility, and volume indicators to provide a comprehensive outlook on the possible future stock price movement. By examining these key aspects, we aim to offer valuable insights and recommendations for potential investors.
Trend Indicators:
- Moving Averages (MA): The 5-day Moving Average (MA) has been fluctuating around the actual closing prices, indicating a lack of clear trend direction.
- MACD and Signal Line: The MACD has been consistently negative, suggesting a bearish momentum in the short term.
- EMA: The Exponential Moving Average (EMA) has been declining, indicating a bearish sentiment in the market.
Momentum Indicators:
- RSI: The Relative Strength Index (RSI) has been hovering around the mid-level, indicating a neutral momentum.
- Stochastic Oscillator: Both %K and %D have been fluctuating, showing indecision in the market.
- Williams %R: The Williams %R is in the oversold territory, suggesting a potential reversal in the short term.
Volatility Indicators:
- Bollinger Bands (BB): The Bollinger Bands have been narrowing, indicating decreasing volatility in the stock price.
- BB% (Bollinger Band %B): The %B is relatively low, suggesting a potential consolidation phase.
Volume Indicators:
- On-Balance Volume (OBV): The OBV has been fluctuating, indicating mixed buying and selling pressure.
- Chaikin Money Flow (CMF): The CMF has been slightly positive, suggesting some accumulation in the stock.
Key Observations:
- The stock is currently experiencing a lack of clear trend direction, as indicated by the moving averages and EMA.
- Momentum indicators show mixed signals, with RSI neutral, Stochastic Oscillator indecisive, and Williams %R in the oversold region.
- Volatility is decreasing, as shown by the narrowing Bollinger Bands, indicating a potential period of consolidation.
- Volume indicators reflect mixed buying and selling pressure, with slight accumulation based on the CMF.
Conclusion:
Based on the analysis of the technical indicators, the stock is likely to consolidate in the near term. The lack of clear trend direction, mixed momentum signals, decreasing volatility, and mixed volume pressure suggest a period of sideways movement. Investors should exercise caution and wait for clearer signals before making significant trading decisions.