Technical Analysis of HG 2024-05-10
Overview:
In analyzing the technical indicators for the stock HG over the last 5 days, we will delve into the trend, momentum, volatility, and volume indicators to provide a comprehensive outlook on the possible stock price movement in the coming days. By examining these key indicators, we aim to offer valuable insights and predictions for informed decision-making.
Trend Indicators:
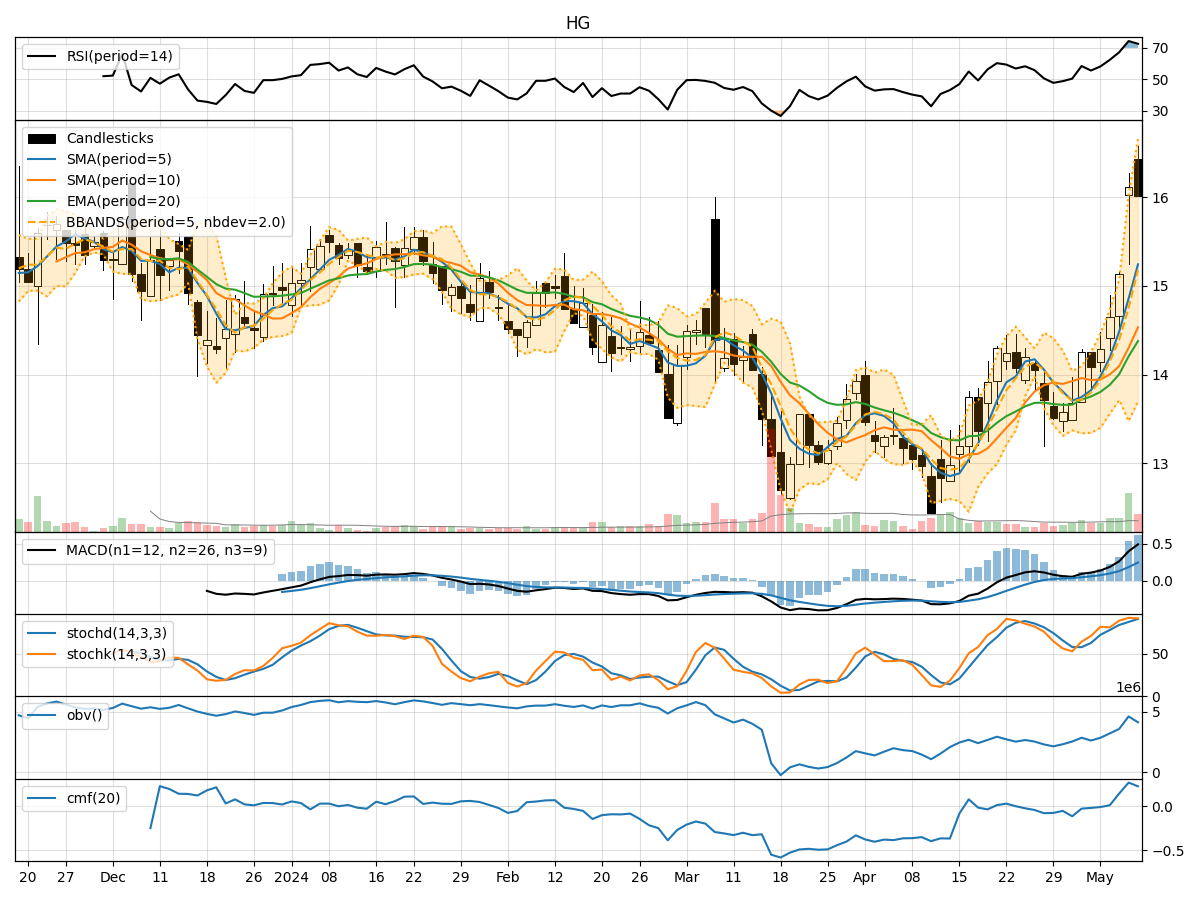
- Moving Averages (MA): The 5-day Moving Average (MA) has been consistently rising, indicating an upward trend in the stock price.
- MACD: The Moving Average Convergence Divergence (MACD) has shown positive values, suggesting bullish momentum.
- EMA: The Exponential Moving Average (EMA) has been increasing steadily, supporting the bullish trend.
Momentum Indicators:
- RSI: The Relative Strength Index (RSI) has been in the overbought territory, indicating strong buying momentum.
- Stochastic Oscillator: Both %K and %D have been in the overbought zone, signaling a potential reversal.
- Williams %R: The Williams %R is in the oversold region, suggesting a possible price bounce.
Volatility Indicators:
- Bollinger Bands: The Bollinger Bands have been widening, indicating increased volatility in the stock price.
- Bollinger %B: The %B indicator has been fluctuating, reflecting the price's deviation from the bands.
Volume Indicators:
- On-Balance Volume (OBV): The OBV has shown mixed signals, with some days recording negative values, indicating distribution.
- Chaikin Money Flow (CMF): The CMF has been positive, suggesting buying pressure in the stock.
Key Observations:
- The trend indicators point towards a bullish sentiment, supported by the moving averages and MACD.
- Momentum indicators show conflicting signals, with RSI in overbought territory and Stochastic Oscillator hinting at a potential reversal.
- Volatility has increased, as seen in the widening Bollinger Bands, indicating potential price swings.
- Volume indicators suggest mixed investor sentiment, with OBV showing distribution and CMF indicating buying pressure.
Conclusion:
Based on the analysis of the technical indicators, the stock HG is likely to experience further upward movement in the coming days, supported by the bullish trend indicated by moving averages and MACD. However, caution is advised as momentum indicators show signs of potential reversal, especially with Stochastic Oscillator in the overbought zone. Increased volatility may lead to price fluctuations, so traders should closely monitor the Bollinger Bands. Overall, a cautiously bullish view is recommended, with attention to potential reversal signals from momentum indicators.