Technical Analysis of HHH 2024-05-10
Overview:
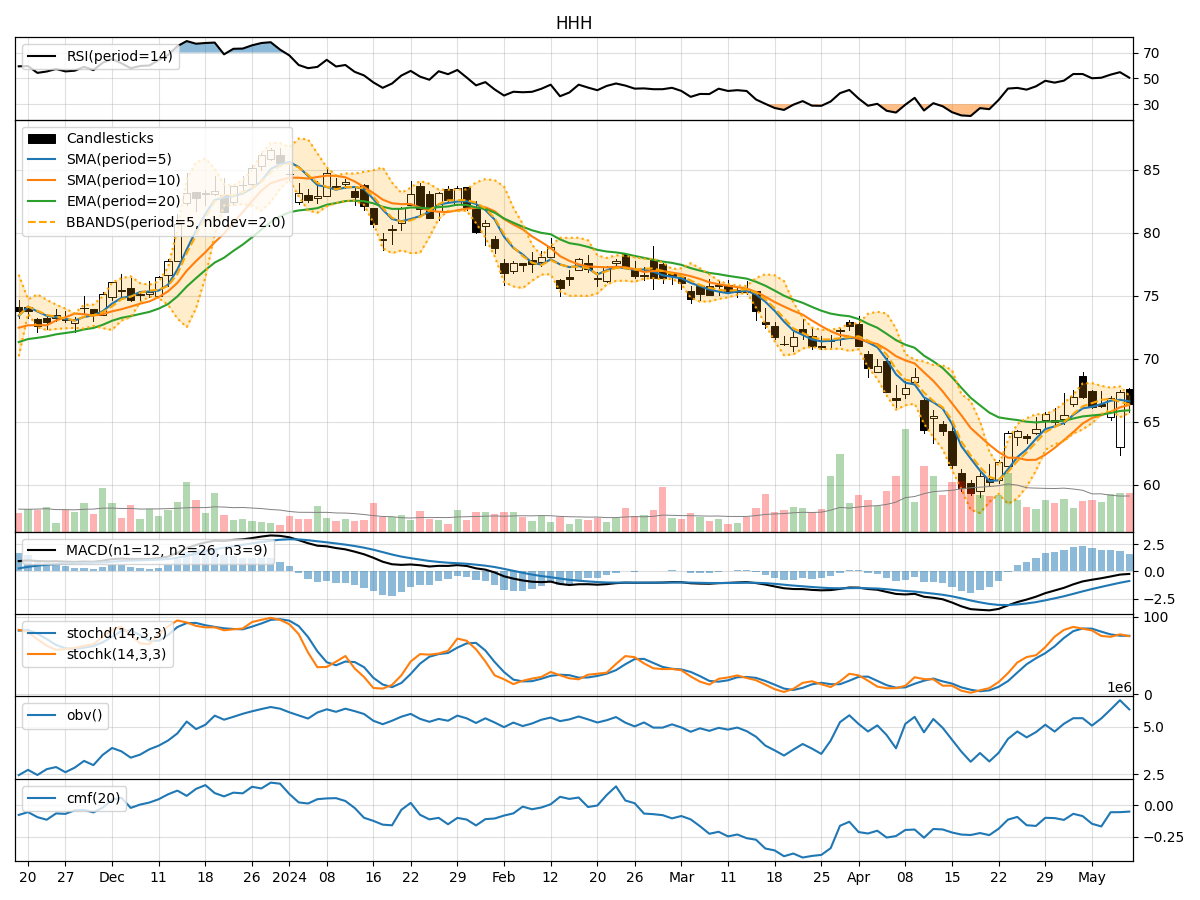
In analyzing the provided technical indicators for the last 5 days of HHH stock, we will delve into the trend, momentum, volatility, and volume indicators to forecast the possible stock price movement in the upcoming days. By examining these key aspects, we aim to provide a comprehensive and insightful prediction for the future direction of HHH stock.
Trend Analysis:
- Moving Averages (MA): The 5-day Moving Average (MA) has been fluctuating around the closing prices, indicating short-term price trends. The Simple Moving Average (SMA) and Exponential Moving Average (EMA) show an overall upward trend.
- MACD: The Moving Average Convergence Divergence (MACD) has been positive, suggesting bullish momentum in the stock price.
- Conclusion: The trend indicators suggest an upward momentum in the stock price.
Momentum Analysis:
- RSI: The Relative Strength Index (RSI) has been fluctuating around the neutral level, indicating a balanced momentum.
- Stochastic Oscillator: Both %K and %D have been in the overbought territory, suggesting a potential reversal.
- Conclusion: The momentum indicators imply a neutral stance in the stock price movement.
Volatility Analysis:
- Bollinger Bands (BB): The Bollinger Bands have been relatively narrow, indicating low volatility in the stock price.
- Conclusion: The volatility indicators suggest a sideways movement or consolidation phase in the stock price.
Volume Analysis:
- On-Balance Volume (OBV): The OBV has shown mixed signals, with fluctuations in volume accumulation.
- Chaikin Money Flow (CMF): The CMF has been negative, indicating selling pressure in the stock.
- Conclusion: The volume indicators suggest a bearish sentiment in the stock price.
Conclusion:
Based on the analysis of trend, momentum, volatility, and volume indicators, the overall outlook for HHH stock in the next few days is as follows: - Trend: Upward - Momentum: Neutral - Volatility: Sideways/Consolidation - Volume: Bearish
Final Prediction:
Considering the mixed signals from different indicators, it is likely that HHH stock may experience some upward movement in the short term due to the positive trend indicators. However, the neutral momentum and bearish volume indicators suggest a cautious approach. Traders should closely monitor the stock for any signs of reversal or continuation of the current trend. Exercise caution and consider risk management strategies in trading HHH stock in the upcoming days.