Technical Analysis of HIW 2024-05-10
Overview:
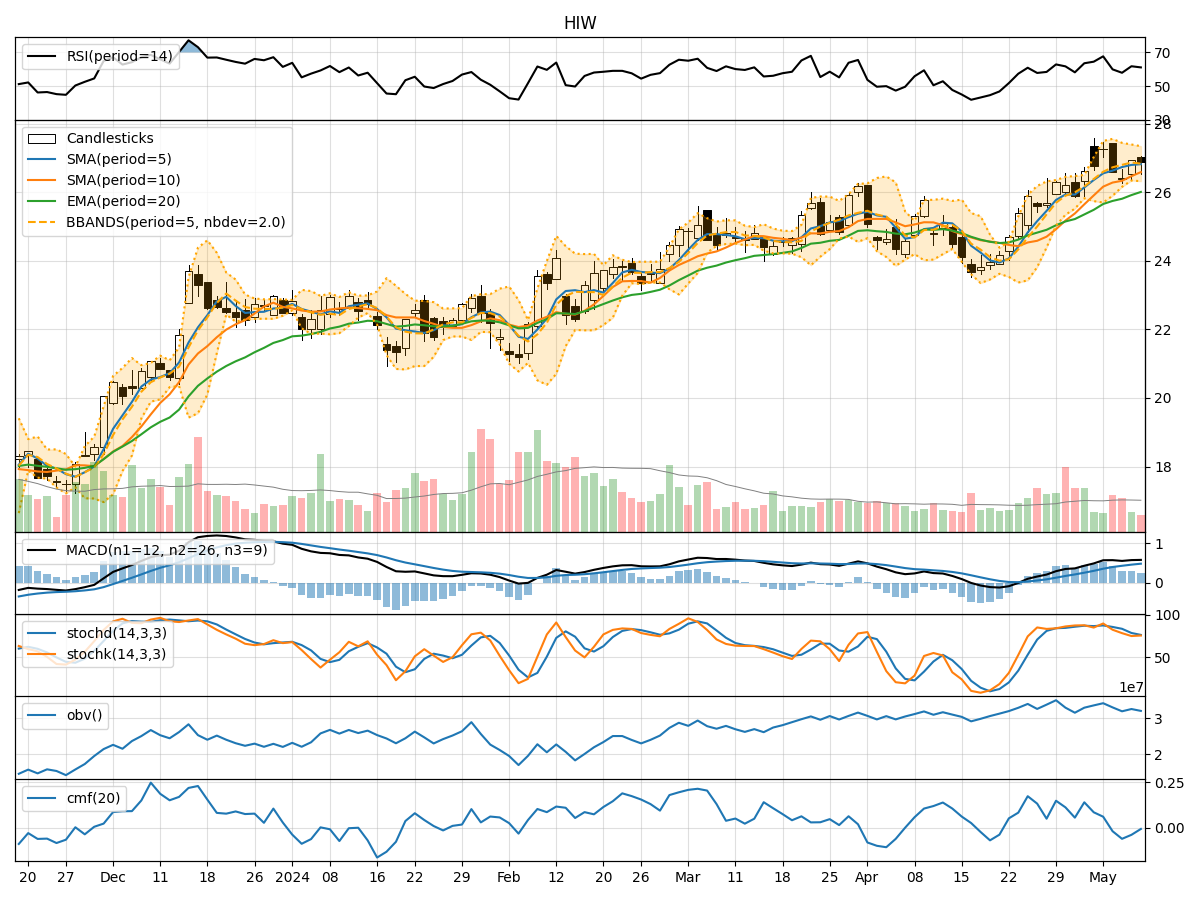
In the last 5 trading days, HIW stock has shown mixed signals across various technical indicators. The trend indicators suggest a slight bullish sentiment, with moving averages and MACD showing positive trends. Momentum indicators indicate a neutral to slightly bearish sentiment, while volatility indicators show a decreasing trend in volatility. Volume indicators also suggest a decrease in buying pressure.
Trend Indicators:
- Moving Averages (MA): The 5-day MA is above the 10-day SMA, indicating a short-term bullish trend. The EMA(20) is also showing an upward trend, supporting a bullish view.
- MACD: The MACD line is above the signal line, indicating a bullish momentum. The MACD histogram is positive, suggesting upward momentum.
Momentum Indicators:
- RSI: The RSI is around 60, indicating a neutral sentiment. It is not in overbought or oversold territory.
- Stochastic Oscillator: Both %K and %D are in the neutral zone, suggesting a lack of strong momentum in either direction.
- Williams %R: The Williams %R is close to oversold levels, indicating a potential buying opportunity.
Volatility Indicators:
- Bollinger Bands (BB): The bands are narrowing, indicating decreasing volatility. This could signal a period of consolidation or a potential breakout.
- BB %B: The %B is around 0.5, suggesting the stock is trading near the middle of the bands.
Volume Indicators:
- On-Balance Volume (OBV): The OBV is showing a slight decrease, indicating a decrease in buying pressure.
- Chaikin Money Flow (CMF): The CMF is negative, suggesting a lack of buying interest over the past 20 days.
Key Observations:
- The trend indicators suggest a bullish sentiment in the short term.
- Momentum indicators show a neutral to slightly bearish outlook.
- Volatility is decreasing, indicating a potential period of consolidation.
- Volume indicators point towards a decrease in buying pressure.
Conclusion:
Based on the analysis of the technical indicators, the next few days for HIW stock are likely to see sideways movement with a slight bullish bias. The decreasing volatility and lack of strong momentum indicators suggest a period of consolidation. Traders may consider waiting for clearer signals before taking significant positions.