Technical Analysis of HLT 2024-05-10
Overview:
In analyzing the technical indicators for HLT over the last 5 days, we will delve into the trend, momentum, volatility, and volume indicators to provide a comprehensive outlook on the possible stock price movement in the coming days. By examining these key aspects, we aim to offer valuable insights and predictions for potential investors.
Trend Analysis:
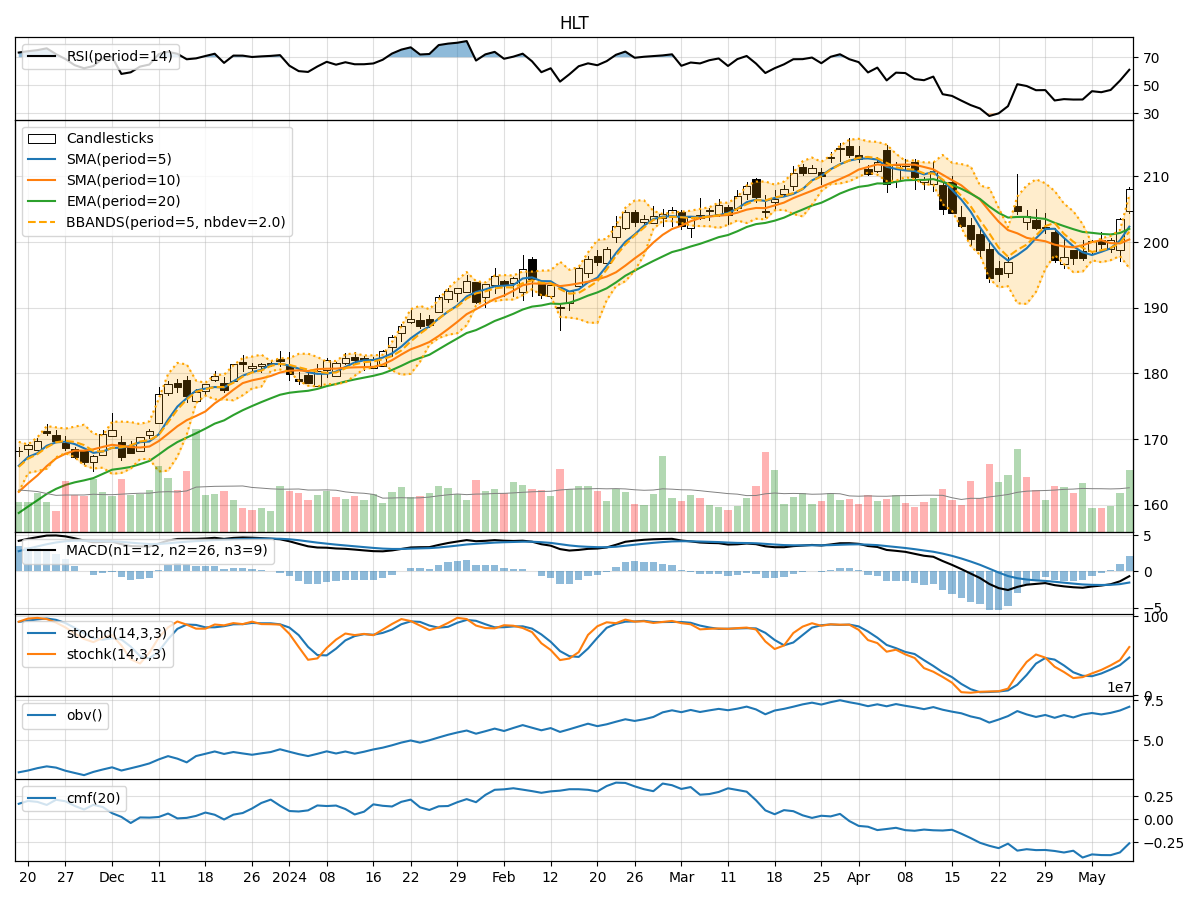
- Moving Averages (MA): The 5-day Moving Average (MA) has been showing an upward trend, indicating a positive momentum in the stock price.
- MACD: The Moving Average Convergence Divergence (MACD) has been consistently improving, with the MACD line crossing above the signal line, suggesting a bullish signal.
- EMA: The Exponential Moving Average (EMA) has been on an upward trajectory, further supporting the bullish trend.
Momentum Analysis:
- RSI: The Relative Strength Index (RSI) has been increasing steadily, reaching a level of 60.99 on the last trading day, indicating a strengthening momentum.
- Stochastic Oscillator: Both %K and %D lines of the Stochastic Oscillator have been rising, signifying an uptrend in momentum.
- Williams %R: The Williams %R indicator has been moving towards the oversold region, potentially signaling a buying opportunity.
Volatility Analysis:
- Bollinger Bands: The Bollinger Bands have been widening, indicating increased volatility in the stock price.
- Bollinger %B: The %B indicator has been hovering around 1, suggesting that the stock price is trading close to the upper band, potentially indicating an overbought condition.
Volume Analysis:
- On-Balance Volume (OBV): The OBV indicator has been showing a positive trend, indicating that volume has been higher on days with upward price movement.
- Chaikin Money Flow (CMF): The CMF has been negative, suggesting some selling pressure in the stock.
Conclusion:
Based on the analysis of the technical indicators, the overall outlook for HLT stock in the next few days appears to be bullish. The trend indicators, momentum indicators, and volatility indicators all point towards a potential continuation of the upward trend in the stock price. The increasing moving averages, improving MACD, rising RSI, and expanding Bollinger Bands all support a bullish view.
Investors may consider taking advantage of potential buying opportunities indicated by the Williams %R nearing oversold levels. However, it is essential to monitor the CMF for any signs of increasing selling pressure. Overall, the technical analysis suggests a favorable outlook for HLT stock in the coming days, with a potential for further price appreciation.