Technical Analysis of HOG 2024-05-10
Overview:
In analyzing the technical indicators for HOG over the last 5 days, we will delve into the trend, momentum, volatility, and volume indicators to provide a comprehensive outlook on the possible stock price movement. By examining these key factors, we aim to offer valuable insights and predictions for the upcoming days.
Trend Analysis:
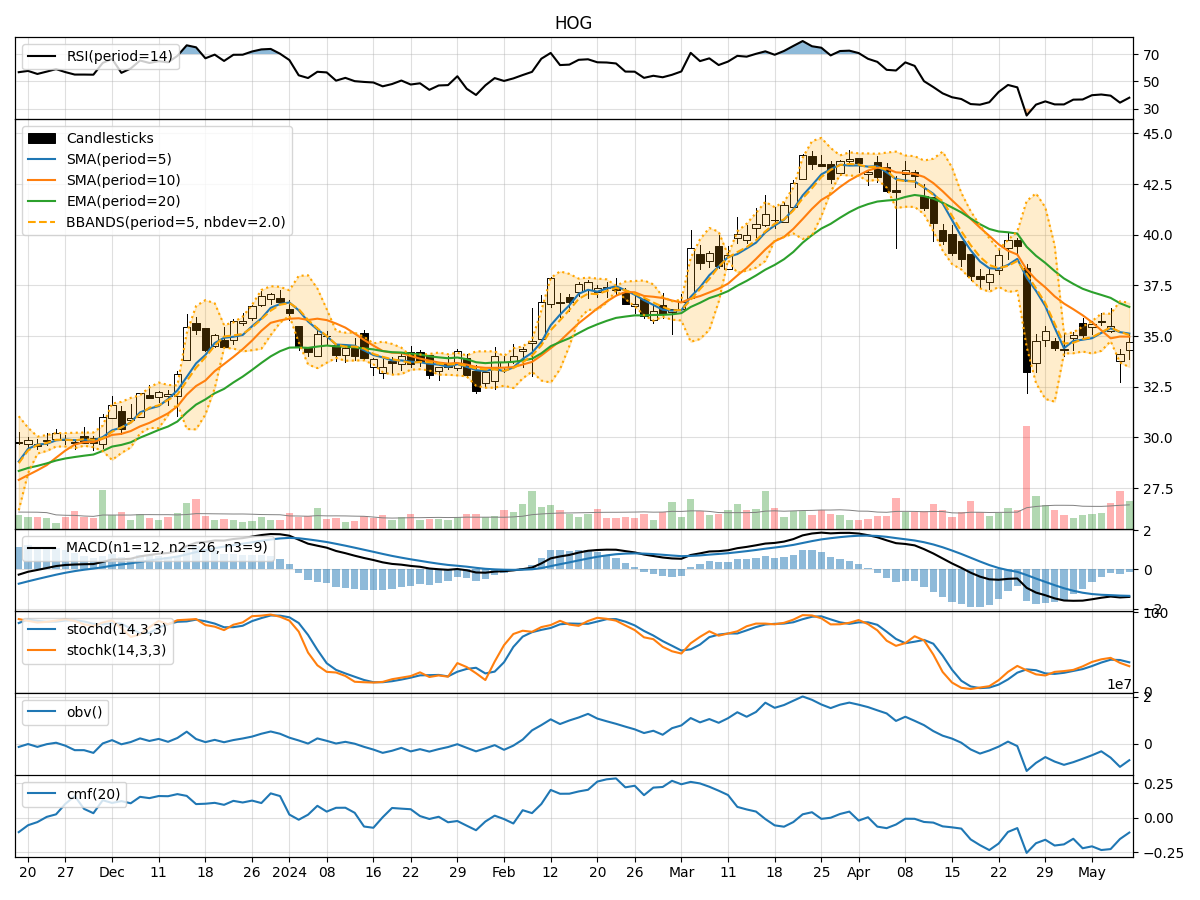
- Moving Averages (MA): The 5-day Moving Average (MA) has been fluctuating around the closing prices, indicating short-term price trends. The Simple Moving Average (SMA) and Exponential Moving Average (EMA) show a downward trend, suggesting a bearish sentiment.
- MACD: The Moving Average Convergence Divergence (MACD) is negative, with the MACD line below the signal line, indicating a bearish trend in momentum.
Momentum Analysis:
- RSI: The Relative Strength Index (RSI) has been below 50, indicating bearish momentum in the stock.
- Stochastic Oscillator: Both %K and %D lines of the Stochastic Oscillator are trending downwards, signaling a bearish momentum.
Volatility Analysis:
- Bollinger Bands (BB): The Bollinger Bands are widening, suggesting increased volatility in the stock price.
Volume Analysis:
- On-Balance Volume (OBV): The OBV has been consistently negative, indicating selling pressure in the stock.
- Chaikin Money Flow (CMF): The CMF is negative, reflecting a lack of buying interest in the stock.
Key Observations:
- The trend indicators, momentum indicators, and volume indicators all point towards a bearish sentiment in the stock.
- The volatility has increased, indicating potential larger price swings in the upcoming days.
Conclusion:
Based on the analysis of the technical indicators, the next few days' possible stock price movement for HOG is likely to be downward. The bearish trend, negative momentum, and selling pressure indicated by the volume indicators suggest that the stock may continue to decline in the short term. Traders and investors should exercise caution and consider shorting or staying away from long positions until a clear reversal pattern emerges.
Disclaimer:
Remember that technical analysis is not a guaranteed predictor of future price movements, and other fundamental factors can influence stock prices. It is essential to conduct thorough research and consider multiple indicators before making any investment decisions. Consulting with a financial advisor can provide tailored insights based on your specific investment goals and risk tolerance level.