Technical Analysis of HR 2024-05-10
Overview:
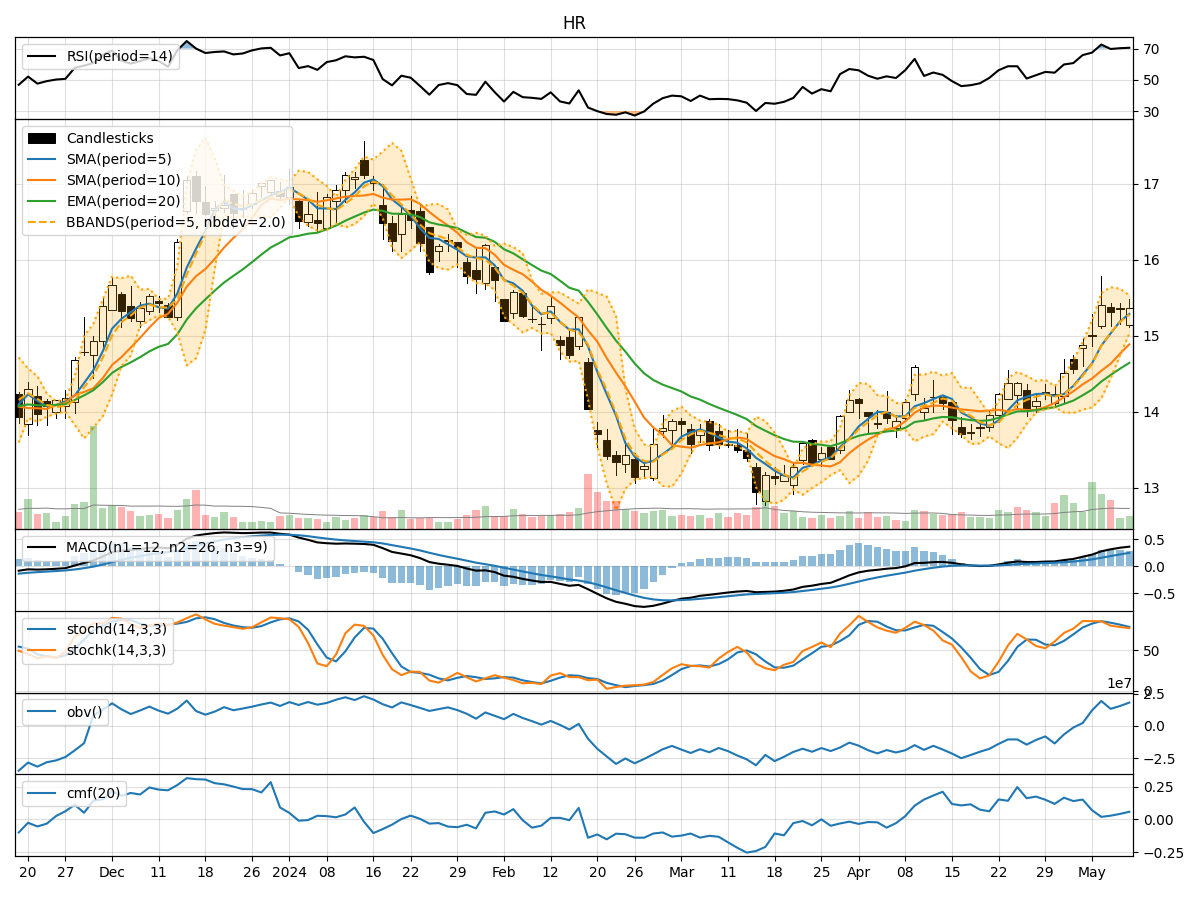
In the last 5 trading days, the stock price of HR has shown a consistent uptrend with increasing closing prices. The moving averages (MA) have been trending upwards, indicating a bullish momentum. The MACD and RSI have also been positive, suggesting strength in the current trend. However, the stock has entered overbought territory based on the Stochastic indicators. Volatility has been relatively stable, and volume has shown an increasing trend.
Trend Analysis:
- Moving Averages (MA): The 5-day MA has been consistently above the 10-day simple moving average (SMA), indicating a short-term bullish trend. The exponential moving average (EMA) has also been trending upwards, supporting the bullish sentiment.
- MACD: The MACD line has been above the signal line for the past 5 days, indicating a bullish trend. The MACD histogram has been increasing, showing strengthening bullish momentum.
Momentum Analysis:
- RSI: The Relative Strength Index (RSI) has been in the overbought zone for the last few days, suggesting that the stock may be due for a pullback or consolidation.
- Stochastic Oscillator: The Stochastic indicators have been in the overbought region, indicating that the stock price may be vulnerable to a potential reversal.
Volatility Analysis:
- Bollinger Bands (BB): The Bollinger Bands have been relatively stable, with the stock price mostly trading within the bands. This suggests that volatility has been contained, but a breakout could occur.
- Bollinger %B (BBP): The %B indicator has been fluctuating around 0.8, indicating that the stock is trading near the upper Bollinger Band.
Volume Analysis:
- On-Balance Volume (OBV): The OBV has been increasing over the last 5 days, indicating that buying pressure has been higher than selling pressure.
- Chaikin Money Flow (CMF): The CMF has been positive, suggesting that money is flowing into the stock.
Key Observations:
- The stock is currently in a strong uptrend based on moving averages and MACD.
- However, overbought conditions indicated by RSI and Stochastic suggest a potential reversal or consolidation.
- Volatility has been contained, but a breakout could lead to a significant price movement.
- Increasing OBV and positive CMF indicate overall bullish sentiment.
Conclusion:
Based on the technical indicators and analysis: - Short-Term: The stock may experience a short-term pullback or consolidation due to overbought conditions. - Medium-Long Term: The overall trend remains bullish, supported by moving averages and positive momentum indicators. - Key Recommendation: Exercise caution for potential short-term correction, but maintain a bullish outlook for the medium to long term.
Final Verdict:
The stock is likely to experience a short-term correction or consolidation before potentially resuming its bullish trend in the medium to long term. Investors should monitor key support levels and be prepared for potential buying opportunities during any pullback.