Technical Analysis of HRL 2024-05-10
Overview:
In analyzing the technical indicators for HRL over the last 5 days, we will delve into the trend, momentum, volatility, and volume indicators to provide a comprehensive outlook on the possible stock price movement in the coming days.
Trend Analysis:
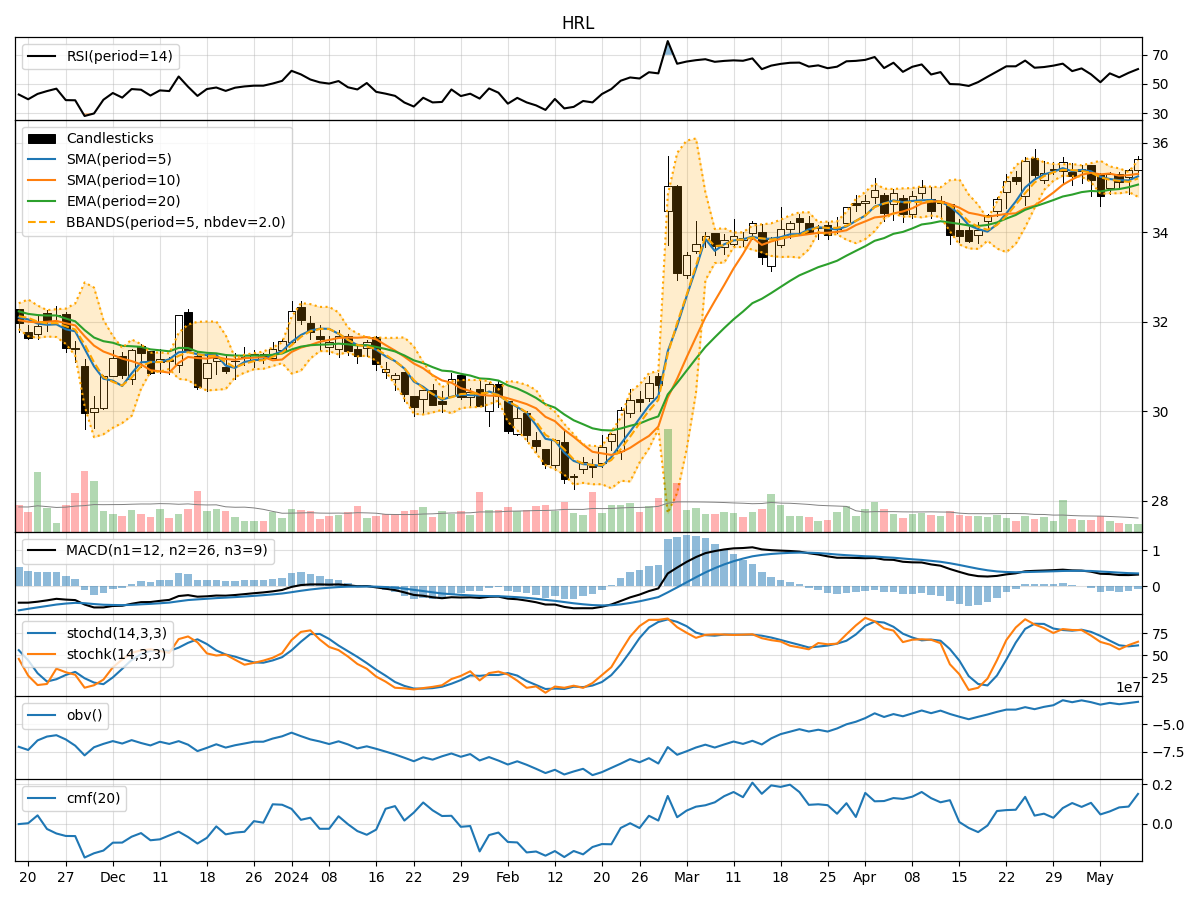
- Moving Averages (MA): The 5-day Moving Average (MA) has been fluctuating around the closing prices, indicating a lack of clear trend direction.
- MACD: The MACD line has been positive, but the MACD Histogram has been decreasing, suggesting a potential weakening of the bullish momentum.
Momentum Analysis:
- RSI: The Relative Strength Index (RSI) has been hovering around the neutral zone, indicating a balanced momentum between buying and selling pressure.
- Stochastic Oscillator: Both %K and %D have been fluctuating, reflecting indecision in the market sentiment.
Volatility Analysis:
- Bollinger Bands (BB): The Bollinger Bands have been relatively narrow, suggesting low volatility in the stock price movement.
- Bollinger %B: The %B indicator has been fluctuating around the midline, indicating a lack of extreme price movements.
Volume Analysis:
- On-Balance Volume (OBV): The OBV has been showing a slight increase, indicating a potential accumulation of the stock.
- Chaikin Money Flow (CMF): The CMF has been positive, suggesting buying pressure in the market.
Key Observations:
- The trend indicators show a lack of clear direction, with a potential weakening of bullish momentum.
- Momentum indicators reflect a balanced market sentiment with no strong bias towards buying or selling.
- Volatility remains low, indicating stable price movements.
- Volume indicators suggest a slight accumulation of the stock with buying pressure in the market.
Conclusion:
Based on the analysis of the technical indicators, the stock price of HRL is likely to consolidate in the coming days. The lack of a clear trend direction, balanced momentum, low volatility, and slight accumulation of the stock indicate a period of sideways movement with no significant upward or downward trend expected. Traders may consider adopting a neutral stance and closely monitor any potential breakout or reversal signals in the technical indicators for future trading decisions.