Technical Analysis of HUBB 2024-05-10
Overview:
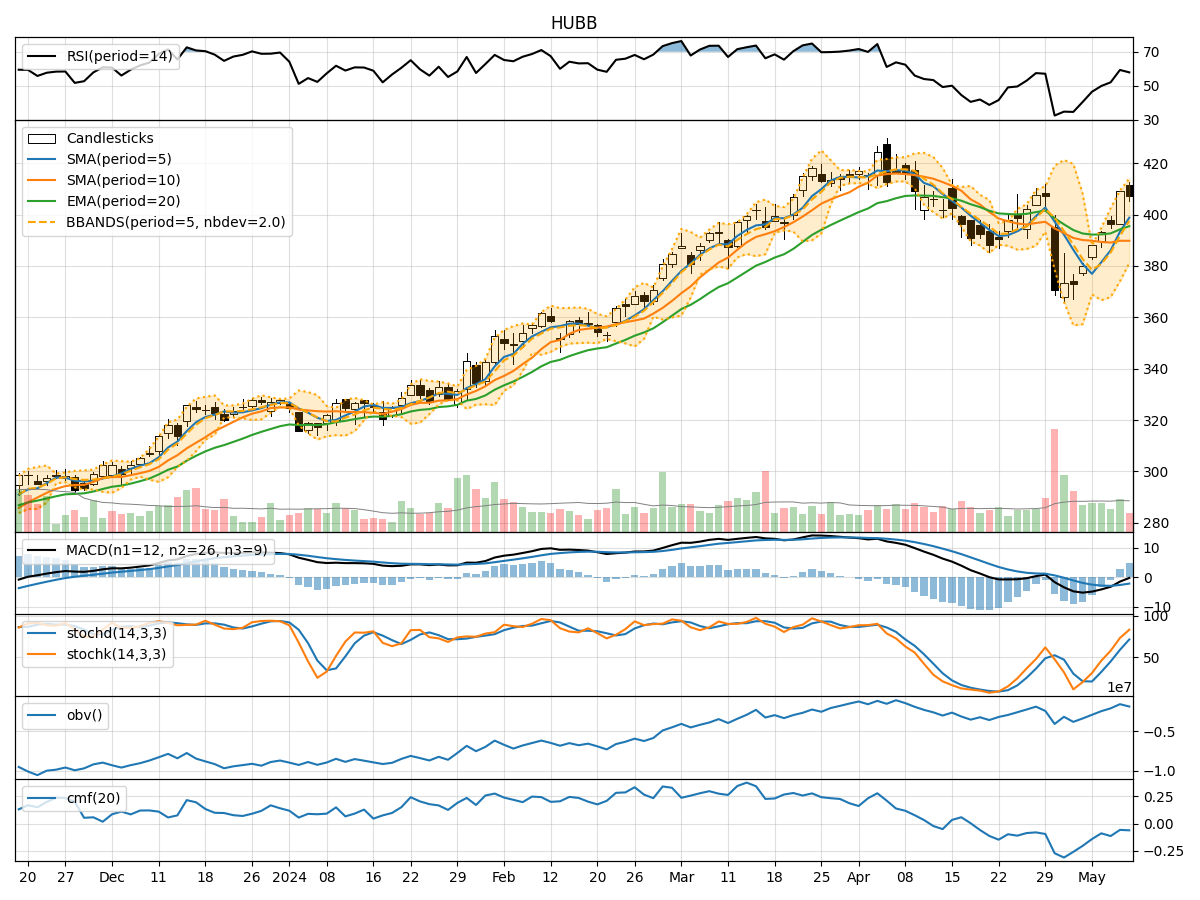
In analyzing the technical indicators for HUBB over the last 5 days, we will delve into the trend, momentum, volatility, and volume indicators to provide a comprehensive outlook on the possible stock price movement in the coming days. By examining these key indicators, we aim to offer valuable insights and predictions for potential investors.
Trend Indicators:
- Moving Averages (MA): The 5-day moving average has been consistently above the simple moving average (SMA) and exponential moving average (EMA), indicating a bullish trend.
- MACD: The MACD line has been above the signal line, with the MACD histogram showing an increasing positive trend, suggesting bullish momentum.
- Conclusion: The trend indicators point towards an upward trend in the stock price.
Momentum Indicators:
- RSI: The Relative Strength Index (RSI) has been increasing and is approaching the overbought territory, indicating strong buying momentum.
- Stochastic Oscillator: Both %K and %D lines of the Stochastic Oscillator are in the overbought zone, signaling a potential reversal.
- Conclusion: Momentum indicators suggest a bullish sentiment in the short term, but caution is advised due to the overbought conditions.
Volatility Indicators:
- Bollinger Bands: The stock price has been trading near the upper Bollinger Band, indicating high volatility and a potential overbought situation.
- Conclusion: Volatility indicators suggest a high volatility environment, which could lead to a potential price correction or consolidation.
Volume Indicators:
- On-Balance Volume (OBV): The OBV has been increasing, indicating accumulation by investors.
- Chaikin Money Flow (CMF): The CMF has been negative, suggesting selling pressure in the stock.
- Conclusion: Volume indicators show mixed signals with accumulation in OBV but selling pressure in CMF.
Overall Conclusion:
Based on the analysis of trend, momentum, volatility, and volume indicators, the next few days' possible stock price movement for HUBB is likely to be upward in the short term. However, caution is advised due to the overbought conditions in momentum indicators and high volatility as indicated by Bollinger Bands. Investors should closely monitor the price action and consider potential profit-taking opportunities as the stock may enter a consolidation phase or experience a minor pullback in the near future.
Key Recommendations:
- Monitor Overbought Conditions: Keep a close eye on the RSI and Stochastic Oscillator for potential reversal signals.
- Watch Volatility Levels: Be prepared for price corrections or consolidation as the stock is trading near the upper Bollinger Band.
- Consider Profit-Taking: Evaluate taking profits if the stock price continues to rise rapidly to manage risk effectively.
By combining technical analysis with market insights, investors can make informed decisions and navigate the dynamic landscape of the stock market effectively.