Technical Analysis of HUN 2024-05-10
Overview:
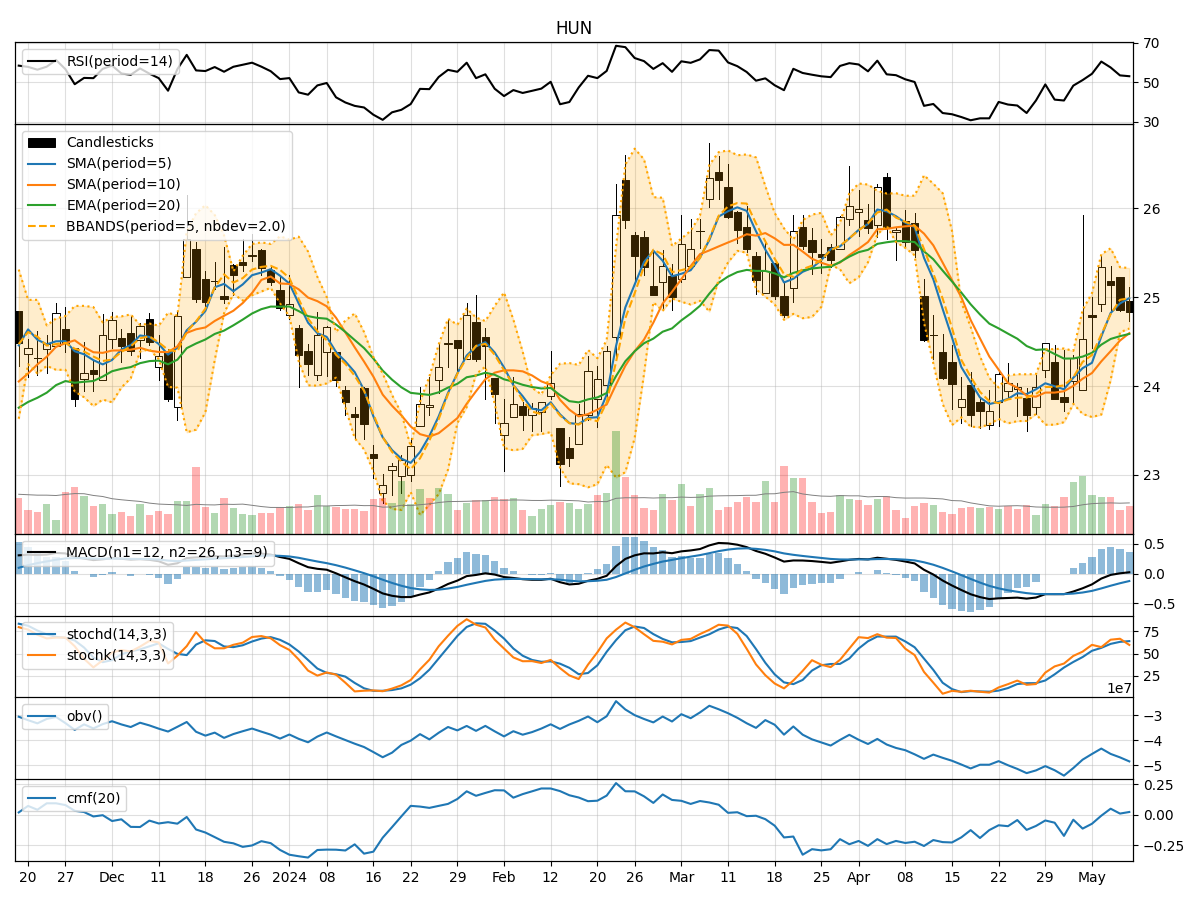
In analyzing the technical indicators for HUN stock over the last 5 days, we will delve into the trends, momentum, volatility, and volume indicators to provide a comprehensive outlook on the possible future stock price movement. By examining these key indicators, we aim to offer valuable insights and recommendations for potential investors.
Trend Analysis:
- Moving Averages (MA): The 5-day MA has been consistently above the closing prices, indicating a short-term uptrend.
- MACD: The MACD line has been positive, suggesting bullish momentum.
- RSI: The RSI has been fluctuating around the 50 level, indicating a neutral stance.
Momentum Analysis:
- Stochastic Oscillator: The Stochastic indicators have shown mixed signals, with some days indicating overbought conditions.
- Williams %R: The Williams %R has been hovering in the oversold territory, signaling potential buying opportunities.
Volatility Analysis:
- Bollinger Bands (BB): The Bollinger Bands have been narrowing, suggesting decreasing volatility.
- BB %B: The %B indicator has been relatively low, indicating a potential reversal or consolidation.
Volume Analysis:
- On-Balance Volume (OBV): The OBV has been declining, indicating selling pressure.
- Chaikin Money Flow (CMF): The CMF has been fluctuating around the zero line, reflecting a balance between buying and selling pressure.
Key Observations:
- The trend indicators suggest a short-term uptrend, supported by positive MACD.
- Momentum indicators show mixed signals, with stochastic oscillators indicating potential overbought conditions.
- Volatility has been decreasing, as indicated by narrowing Bollinger Bands.
- Volume indicators reflect selling pressure, with OBV showing a decline.
Conclusion:
Based on the analysis of the technical indicators, the stock price of HUN is likely to experience a short-term upward movement. However, caution is advised due to mixed signals from momentum indicators and potential overbought conditions. The decreasing volatility and selling pressure indicated by volume indicators may lead to a period of consolidation or a minor pullback before further upside potential. Investors should closely monitor the price action and key support/resistance levels for timely decision-making.