Technical Analysis of HUYA 2024-05-10
Overview:
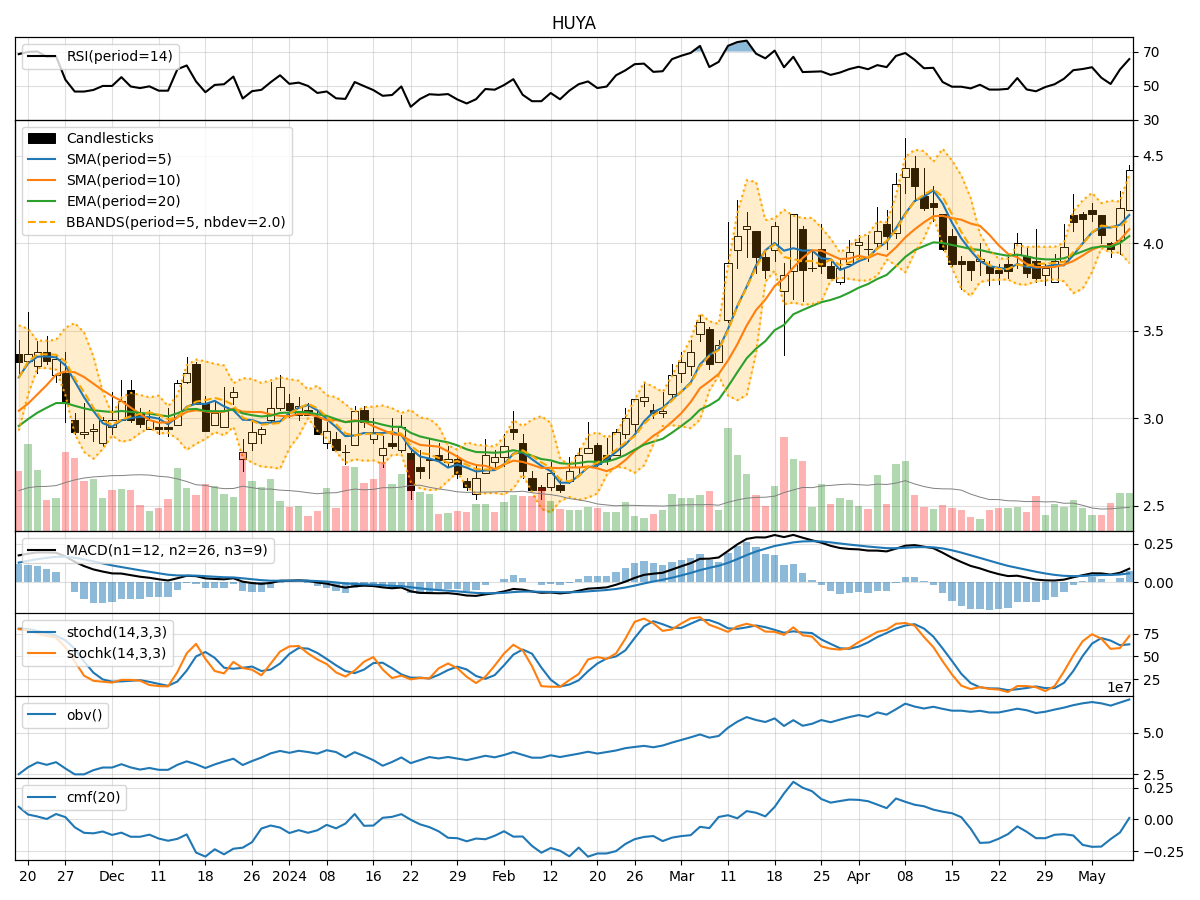
In analyzing the technical indicators for HUYA over the last 5 days, we will delve into the trend, momentum, volatility, and volume indicators to provide a comprehensive assessment of the stock's potential price movement. By examining these key factors, we aim to offer valuable insights and predictions for the next few days.
Trend Analysis:
- Moving Averages (MA): The 5-day MA has been showing an upward trend, indicating a positive momentum in the stock price.
- MACD: The MACD line has been consistently above the signal line, suggesting a bullish trend.
- EMA: The exponential moving average has been steadily increasing, supporting the bullish sentiment in the short to medium term.
Key Observation: The trend indicators point towards a bullish outlook for HUYA.
Momentum Analysis:
- RSI: The Relative Strength Index has been fluctuating but generally staying above the oversold threshold, indicating bullish momentum.
- Stochastic Oscillator: Both %K and %D have been in the overbought zone, suggesting strong buying pressure.
- Williams %R: The indicator has been hovering near the oversold territory, signaling potential buying opportunities.
Key Observation: Momentum indicators reflect a bullish sentiment in the stock.
Volatility Analysis:
- Bollinger Bands: The bands have been widening, indicating increased volatility in the stock price.
- Bollinger %B: The %B value has been fluctuating but generally staying above 0.5, suggesting an uptrend.
- Average True Range (ATR): The ATR has shown an increase, indicating higher volatility in the stock.
Key Observation: Volatility indicators suggest a volatile trading environment for HUYA.
Volume Analysis:
- On-Balance Volume (OBV): The OBV has been fluctuating but generally showing an uptrend, indicating accumulation by investors.
- Chaikin Money Flow (CMF): The CMF has been negative, suggesting some selling pressure in the stock.
Key Observation: Volume indicators indicate a mixed sentiment with a slight bias towards accumulation.
Conclusion:
Based on the comprehensive analysis of trend, momentum, volatility, and volume indicators, the overall outlook for HUYA in the next few days is bullish with a potential for increased volatility. Investors may consider taking advantage of buying opportunities during price dips while being mindful of the heightened volatility. It is advisable to closely monitor the trend and volume dynamics for confirmation of the bullish bias.
In conclusion, considering the technical indicators and market dynamics, the next few days for HUYA are likely to see upward price movement with potential fluctuations due to increased volatility. Investors should exercise caution and consider risk management strategies while capitalizing on the bullish momentum in the stock.