Technical Analysis of HYLN 2024-05-10
Overview:
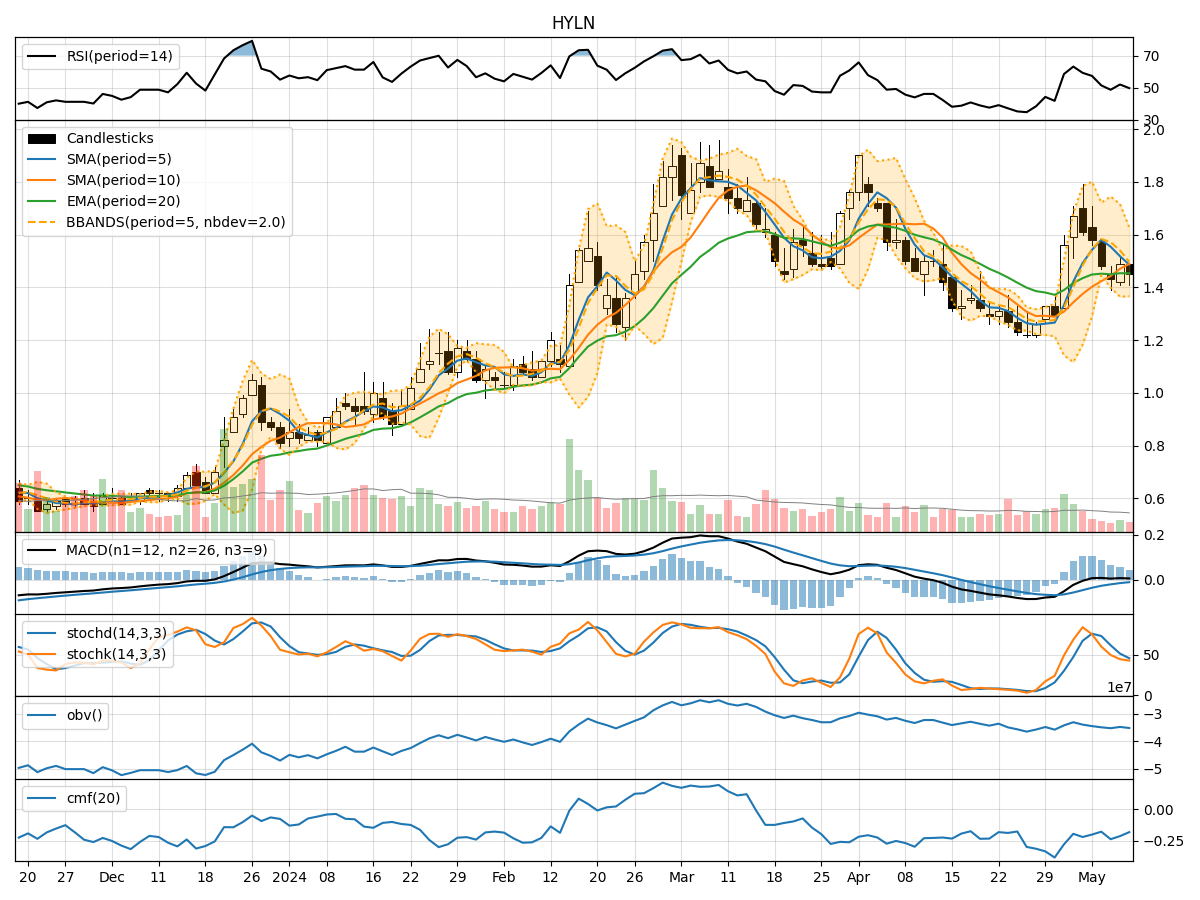
In analyzing the technical indicators for HYLN over the last 5 days, we will delve into the trend, momentum, volatility, and volume indicators to provide a comprehensive outlook on the possible stock price movement in the coming days. By examining these key aspects, we aim to offer valuable insights and predictions to guide your investment decisions.
Trend Analysis:
- Moving Averages (MA): The 5-day Moving Average (MA) has been fluctuating around the closing prices, indicating short-term price trends. The Simple Moving Average (SMA) and Exponential Moving Average (EMA) show a slight convergence, suggesting potential stability in the price movement.
- MACD: The Moving Average Convergence Divergence (MACD) and its signal line have been hovering around zero, indicating a balanced momentum in the stock price.
- Conclusion: The trend indicators suggest a sideways movement in the stock price with a potential for consolidation in the near term.
Momentum Analysis:
- RSI: The Relative Strength Index (RSI) has been oscillating around the 50 level, indicating a neutral momentum in the stock.
- Stochastic Oscillator: Both %K and %D lines of the Stochastic Oscillator are in the oversold territory, suggesting a potential reversal in the price trend.
- Conclusion: The momentum indicators imply a neutral stance with a slight bullish bias due to the oversold conditions of the Stochastic Oscillator.
Volatility Analysis:
- Bollinger Bands (BB): The Bollinger Bands are narrowing, indicating decreasing volatility in the stock price.
- Conclusion: The volatility indicators point towards a decreasing volatility environment, which could lead to a tighter trading range in the upcoming sessions.
Volume Analysis:
- On-Balance Volume (OBV): The OBV has been fluctuating, suggesting a balance between buying and selling pressure.
- Chaikin Money Flow (CMF): The CMF is negative, indicating a slight outflow of money from the stock.
- Conclusion: The volume indicators reflect a neutral sentiment with a slight bearish bias due to the negative CMF.
Overall Conclusion:
Based on the analysis of trend, momentum, volatility, and volume indicators, the next few days' possible stock price movement for HYLN is likely to be sideways with a neutral to slightly bullish bias. Traders should be cautious of the potential for consolidation within a tight trading range due to decreasing volatility. It is advisable to closely monitor key support and resistance levels for any potential breakout or reversal signals.
Key Takeaways:
- Trend: Sideways with consolidation.
- Momentum: Neutral with a slight bullish bias.
- Volatility: Decreasing volatility, tighter trading range expected.
- Volume: Neutral with a slight bearish bias.
In conclusion, while the technical indicators suggest a mixed outlook for HYLN, investors should remain vigilant and adapt their strategies accordingly to navigate the evolving market conditions.