Technical Analysis of IAG 2024-05-10
Overview:
In analyzing the technical indicators for IAG over the last 5 days, we will delve into the trend, momentum, volatility, and volume indicators to provide a comprehensive outlook on the possible stock price movement. By examining these key aspects, we aim to offer valuable insights and predictions for the upcoming days.
Trend Analysis:
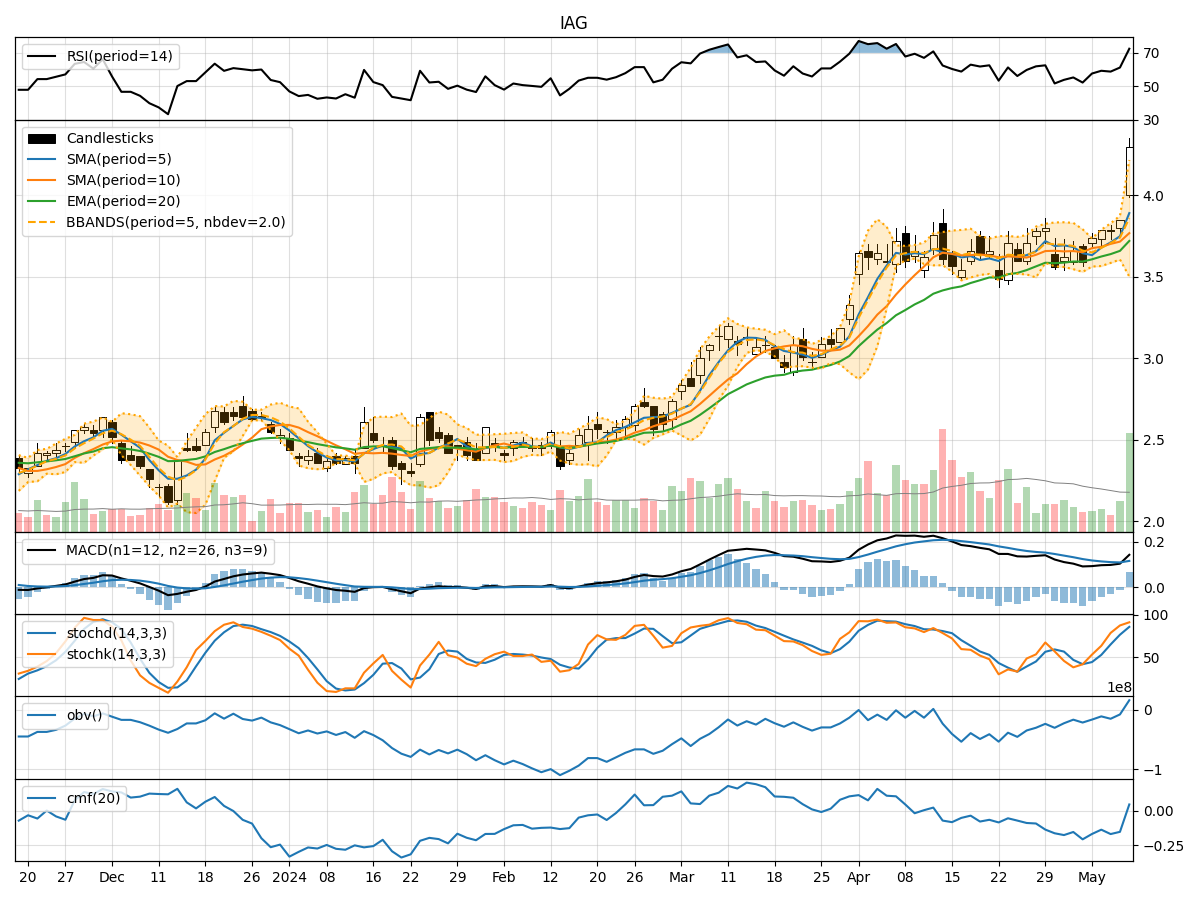
- Moving Averages (MA): The 5-day Moving Average (MA) has been steadily increasing, indicating a positive trend in the stock price.
- MACD: The MACD line has been consistently above the signal line, suggesting bullish momentum in the stock.
Key Observation: The stock is in an upward trend based on the moving averages and MACD indicators.
Momentum Analysis:
- RSI: The Relative Strength Index (RSI) has been trending upwards, reaching overbought levels on the last trading day.
- Stochastic Oscillator: Both %K and %D have been in the overbought zone, indicating strong buying momentum.
Key Observation: Momentum indicators suggest the stock is currently overbought.
Volatility Analysis:
- Bollinger Bands (BB): The stock price has breached the upper Bollinger Band, indicating increased volatility and a potential reversal.
Key Observation: Volatility has increased, and the stock may experience a pullback.
Volume Analysis:
- On-Balance Volume (OBV): The OBV has been increasing, reflecting higher buying volume in the stock.
- Chaikin Money Flow (CMF): The CMF has been negative, indicating selling pressure in the stock.
Key Observation: Despite the increase in OBV, the CMF suggests bearish sentiment in the stock.
Conclusion:
Based on the technical indicators analyzed: - The stock is in an upward trend with bullish momentum. - However, the stock is currently overbought and has breached the upper Bollinger Band, signaling increased volatility and a potential pullback. - The conflicting signals from volume indicators suggest a mixed outlook for the stock.
Recommendation:
Considering the overbought conditions, increased volatility, and bearish sentiment in volume indicators, it is advisable to exercise caution. A short-term correction or consolidation phase may be on the horizon. Traders should consider taking profits or implementing risk management strategies.
Key Words:
- Upward Trend
- Overbought
- Pullback
- Bearish Sentiment
- Mixed Outlook
- Short-term Correction
- Consolidation