Technical Analysis of IBN 2024-05-10
Overview:
In analyzing the technical indicators for IBN over the last 5 days, we will delve into the trend, momentum, volatility, and volume indicators to provide a comprehensive outlook on the possible stock price movement in the coming days. By examining these key aspects, we aim to offer valuable insights and predictions for informed decision-making.
Trend Analysis:
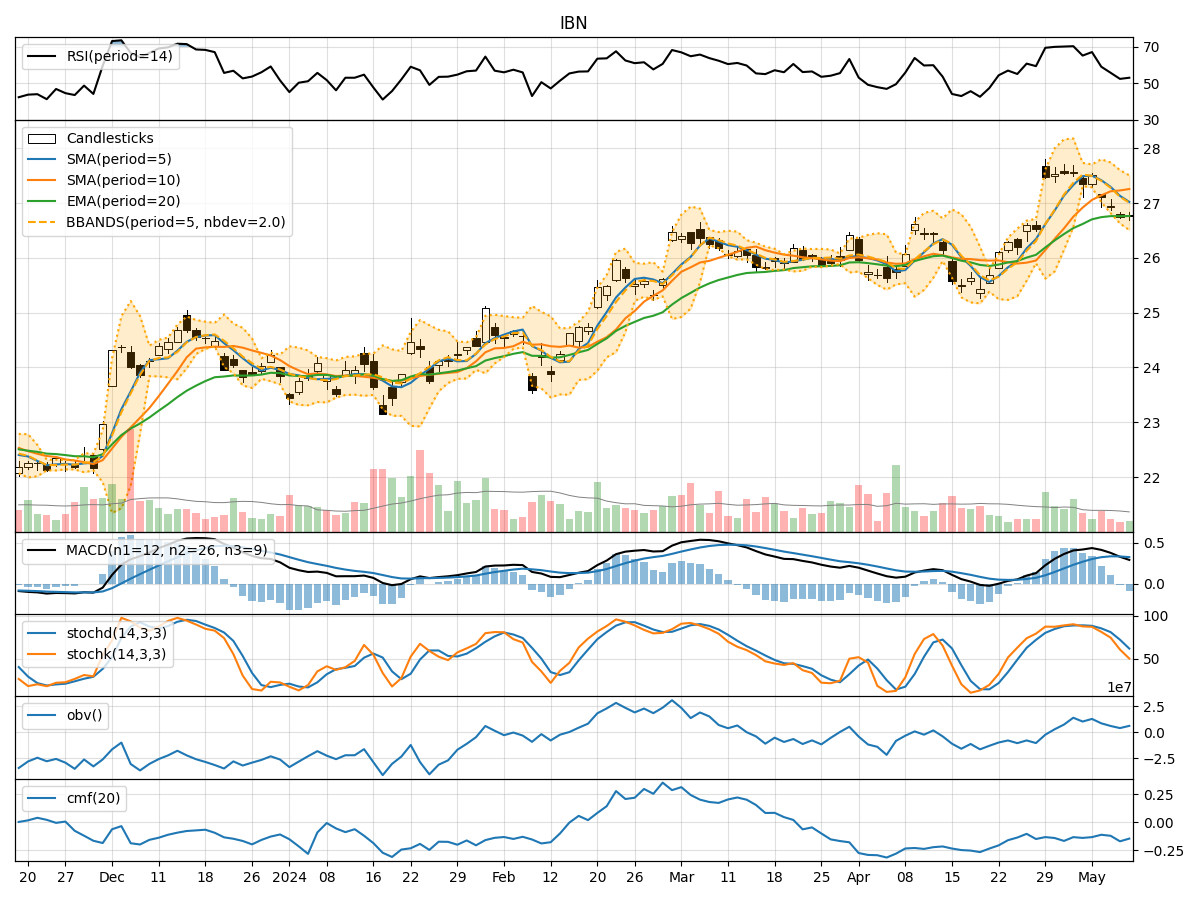
- Moving Averages (MA): The 5-day Moving Average (MA) has been gradually decreasing, indicating a short-term bearish trend.
- MACD: The MACD line has been declining, with the MACD histogram also showing a decrease in positive momentum.
- EMA: The Exponential Moving Average (EMA) has been relatively stable but below the current price, suggesting a potential resistance level.
Momentum Analysis:
- RSI: The Relative Strength Index (RSI) has been decreasing, indicating a weakening momentum.
- Stochastic Oscillator: Both %K and %D have been declining, signaling a bearish momentum.
- Williams %R: The Williams %R is in the oversold territory, suggesting a potential reversal or consolidation.
Volatility Analysis:
- Bollinger Bands (BB): The stock price has been trading within the lower Bollinger Band, indicating a potential oversold condition.
- Bollinger Band Width: The Band Width has been narrowing, suggesting a decrease in volatility.
- Bollinger Band %B: The %B indicator is below 0.2, indicating a potential oversold condition.
Volume Analysis:
- On-Balance Volume (OBV): The OBV has been declining, indicating selling pressure in the stock.
- Chaikin Money Flow (CMF): The CMF has been negative, suggesting a lack of buying interest.
Conclusion:
Based on the analysis of the technical indicators, the stock of IBN is currently in a bearish phase. The trend indicators, momentum oscillators, volatility measures, and volume indicators all point towards a potential downward movement in the stock price in the coming days. Traders and investors should exercise caution and consider waiting for a more favorable entry point before considering any long positions. It is advisable to monitor the price action closely for any signs of a reversal or consolidation before considering any bullish positions.