Technical Analysis of IDA 2024-05-10
Overview:
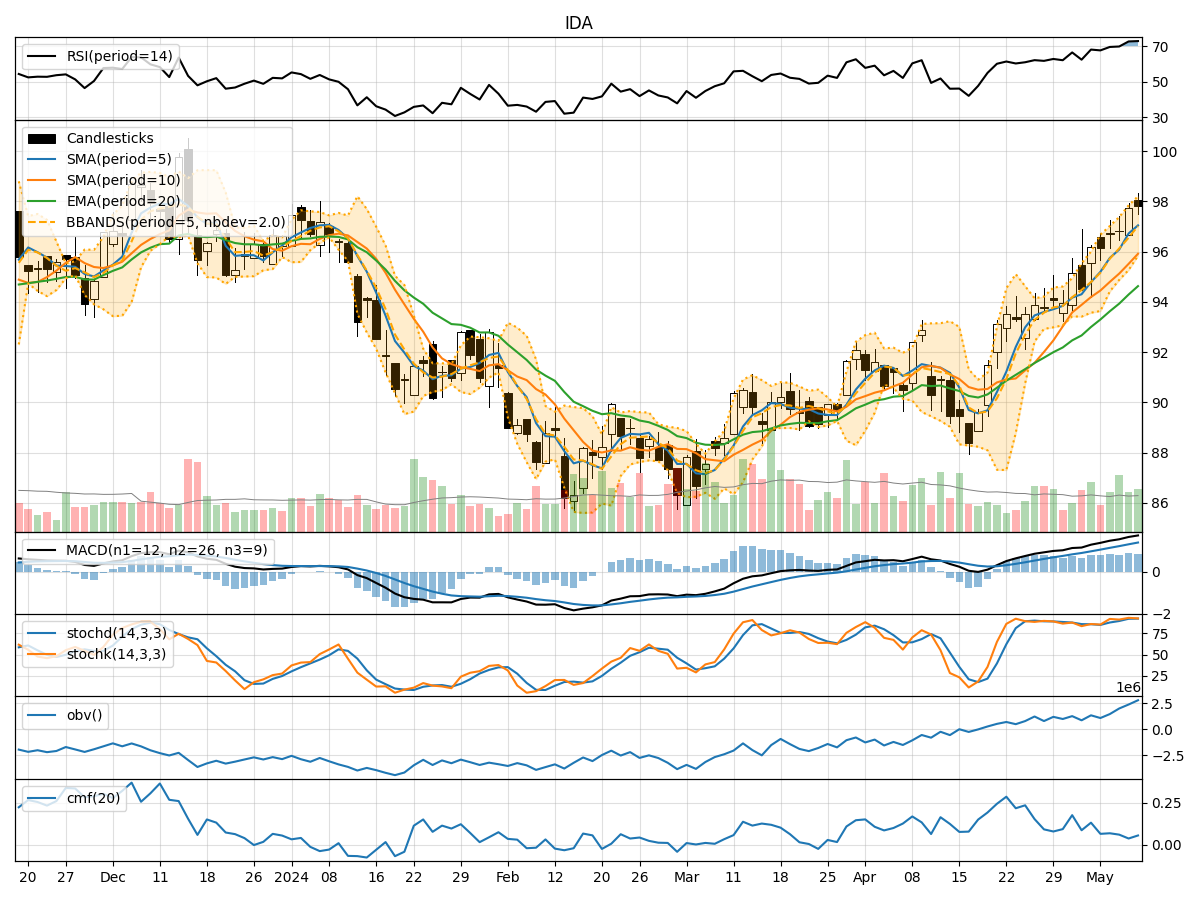
In the last 5 trading days, IDA stock has shown a consistent uptrend in both price and volume. The moving averages (MA) have been trending upwards, with the 5-day MA consistently above the 10-day simple moving average (SMA). The MACD and RSI indicators also suggest bullish momentum. Bollinger Bands indicate increasing volatility, while the On-Balance Volume (OBV) and Chaikin Money Flow (CMF) show positive accumulation. Based on these indicators, the stock is likely to continue its upward trajectory in the next few days.
Trend Indicators Analysis:
- Moving Averages (MA): The 5-day MA has been consistently above the 10-day SMA, indicating a bullish trend.
- MACD: The MACD line has been above the signal line, suggesting bullish momentum.
- MACD Histogram: The histogram has been positive, indicating increasing bullish momentum.
Key Observation: The trend indicators all point towards a strong bullish sentiment in the stock.
Momentum Indicators Analysis:
- RSI: The RSI has been in the overbought territory, indicating strong buying pressure.
- Stochastic Oscillator: Both %K and %D lines have been in the overbought zone, suggesting a strong uptrend.
- Williams %R: The indicator has been in the oversold region, indicating a potential reversal to the upside.
Key Observation: Momentum indicators signal a strong bullish sentiment with potential for a short-term pullback due to overbought conditions.
Volatility Indicators Analysis:
- Bollinger Bands: The bands have been widening, indicating increasing volatility.
Key Observation: The expanding Bollinger Bands suggest a potential for higher volatility in the stock price.
Volume Indicators Analysis:
- On-Balance Volume (OBV): The OBV has been steadily increasing, indicating strong buying pressure.
- Chaikin Money Flow (CMF): The CMF has been positive, suggesting accumulation by investors.
Key Observation: Volume indicators support the bullish trend in the stock.
Conclusion:
Based on the comprehensive analysis of trend, momentum, volatility, and volume indicators, the overall outlook for IDA stock is strongly bullish. The stock is likely to continue its upward trajectory in the next few days, supported by positive trends across all key technical indicators. Traders and investors can consider buying opportunities in IDA stock for potential short to medium-term gains.