Technical Analysis of IFS 2024-05-10
Overview:
In analyzing the technical indicators for IFS stock over the last 5 days, we will delve into the trend, momentum, volatility, and volume indicators to provide a comprehensive outlook on the possible stock price movement in the coming days. By examining these key indicators, we aim to offer valuable insights and predictions for potential investors.
Trend Indicators:
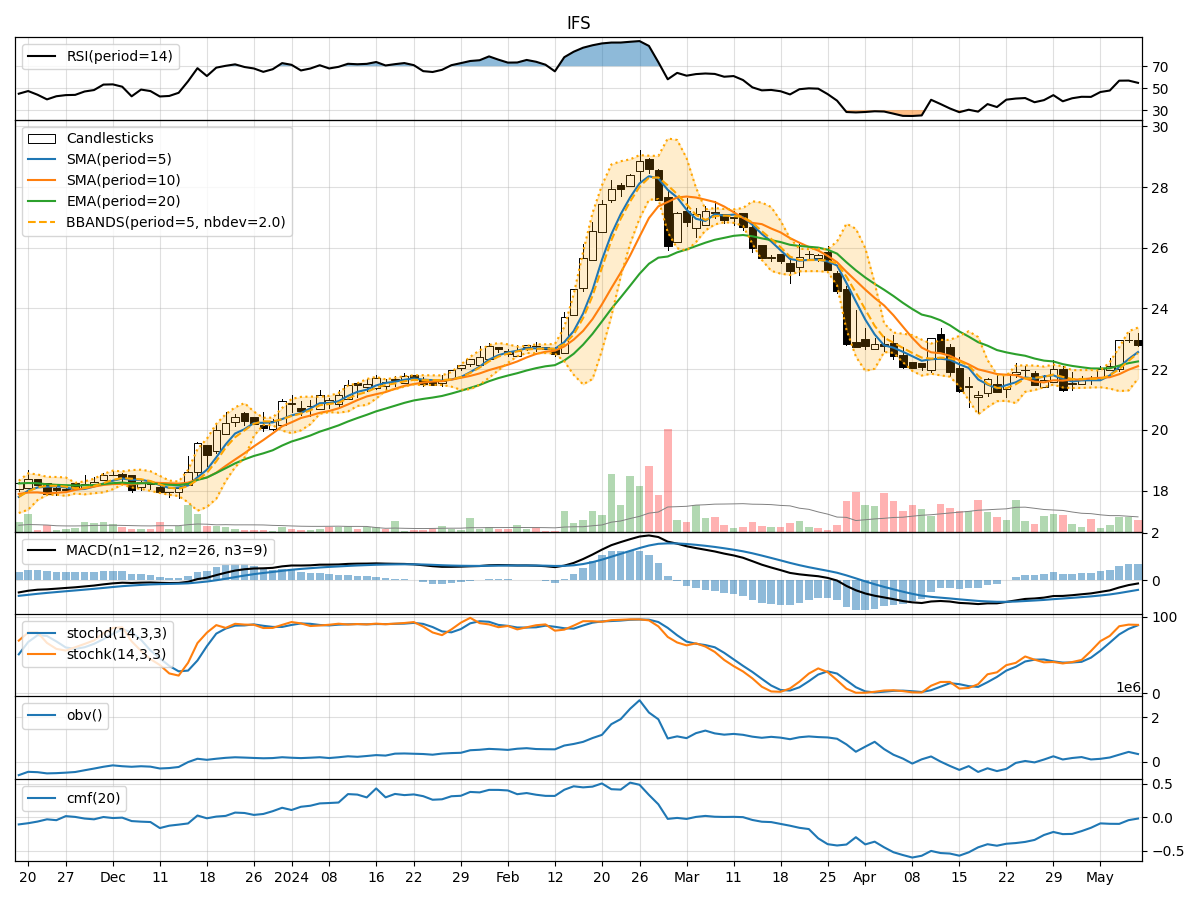
- Moving Averages (MA): The 5-day Moving Average (MA) has been consistently above the closing prices, indicating a bullish trend.
- MACD: The Moving Average Convergence Divergence (MACD) has shown a negative trend but with a decreasing divergence, suggesting a potential reversal.
- EMA: The Exponential Moving Average (EMA) has been above the closing prices, indicating a bullish sentiment.
Momentum Indicators:
- RSI: The Relative Strength Index (RSI) has been fluctuating around the neutral zone, indicating indecision in the market.
- Stochastic Oscillator: Both %K and %D have been in the overbought zone, suggesting a potential reversal.
- Williams %R: The Williams %R is in the oversold territory, indicating a possible buying opportunity.
Volatility Indicators:
- Bollinger Bands: The Bollinger Bands have been widening, indicating increased volatility in the stock price.
- Bollinger %B: The %B indicator has been fluctuating, suggesting potential price reversals.
Volume Indicators:
- On-Balance Volume (OBV): The OBV has been fluctuating, indicating mixed buying and selling pressure.
- Chaikin Money Flow (CMF): The CMF has been negative, indicating a bearish sentiment in the market.
Key Observations:
- The trend indicators suggest a bullish sentiment with the MA and EMA above the closing prices.
- Momentum indicators show mixed signals with RSI in the neutral zone and Stochastic Oscillator indicating potential reversals.
- Volatility indicators point towards increased price fluctuations, potentially leading to trading opportunities.
- Volume indicators reflect mixed buying and selling pressure, with the CMF indicating a bearish sentiment.
Conclusion:
Based on the analysis of the technical indicators, the stock of IFS is likely to experience sideways consolidation in the coming days. The bullish trend indicated by moving averages and EMA may be offset by the mixed signals from momentum and volume indicators. The increased volatility suggests potential price swings, while the bearish sentiment from the CMF warrants caution. Investors should closely monitor the price action and wait for clearer signals before making any significant trading decisions.