Technical Analysis of IGT 2024-05-10
Overview:
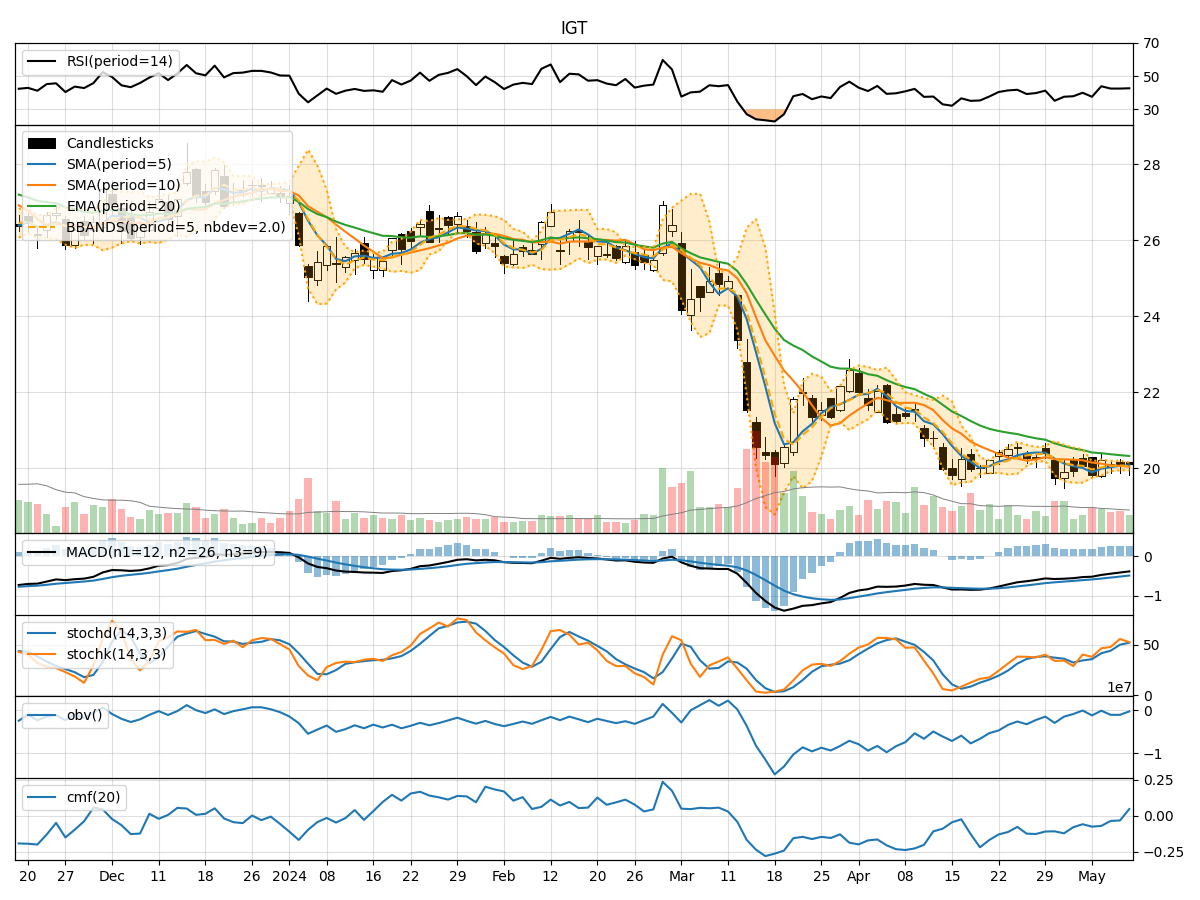
In analyzing the technical indicators for IGT over the last 5 days, we will delve into the trend, momentum, volatility, and volume indicators to provide a comprehensive outlook on the possible stock price movement in the coming days. By examining these key indicators, we aim to offer valuable insights and predictions for informed decision-making.
Trend Analysis:
- Moving Averages (MA): The 5-day Moving Average (MA) has been hovering around the closing prices, indicating a relatively stable trend.
- MACD: The Moving Average Convergence Divergence (MACD) has been negative but showing signs of convergence towards the signal line, suggesting a potential reversal.
- EMA: The Exponential Moving Average (EMA) has been declining, indicating a bearish trend.
Key Observation: The trend is currently bearish, but there are indications of a potential reversal based on the convergence of the MACD.
Momentum Analysis:
- RSI: The Relative Strength Index (RSI) has been in the neutral zone, indicating neither overbought nor oversold conditions.
- Stochastic Oscillator: The Stochastic Oscillator is showing mixed signals, with the %K line crossing the %D line, suggesting a potential change in momentum.
- Williams %R: The Williams %R is in the oversold territory, indicating a possible buying opportunity.
Key Observation: Momentum is currently neutral with some conflicting signals, requiring further confirmation for a clear direction.
Volatility Analysis:
- Bollinger Bands: The Bollinger Bands are narrowing, indicating decreasing volatility and a potential price breakout.
- Bollinger %B: The %B indicator is below 1, suggesting the stock is trading below the lower band, potentially indicating an oversold condition.
Key Observation: Volatility is decreasing, which could precede a significant price movement, possibly to the upside.
Volume Analysis:
- On-Balance Volume (OBV): The OBV has been fluctuating, indicating indecision among market participants.
- Chaikin Money Flow (CMF): The CMF is negative, suggesting selling pressure in the market.
Key Observation: Volume indicators are mixed, reflecting uncertainty in market sentiment.
Conclusion:
Based on the analysis of the technical indicators, the stock price of IGT is likely to experience sideways consolidation in the near term. While the trend is bearish, the convergence of the MACD and narrowing Bollinger Bands indicate a potential reversal or breakout. However, the conflicting signals in momentum and mixed volume indicators suggest a lack of clear direction. Traders should exercise caution and wait for confirmation of a new trend before making significant trading decisions.
Recommendation:
- Short-term Traders: Consider waiting for a clear trend confirmation before entering new positions.
- Long-term Investors: Monitor the price action closely for a potential trend reversal or breakout before making any significant portfolio adjustments.
By staying vigilant and monitoring key technical indicators, investors can position themselves strategically to capitalize on potential price movements in IGT.