Technical Analysis of IIPR 2024-05-10
Overview:
In analyzing the technical indicators for IIPR over the last 5 days, we will delve into the trend, momentum, volatility, and volume indicators to provide a comprehensive outlook on the possible stock price movement. By examining these key factors, we aim to offer valuable insights and predictions for the upcoming days.
Trend Indicators:
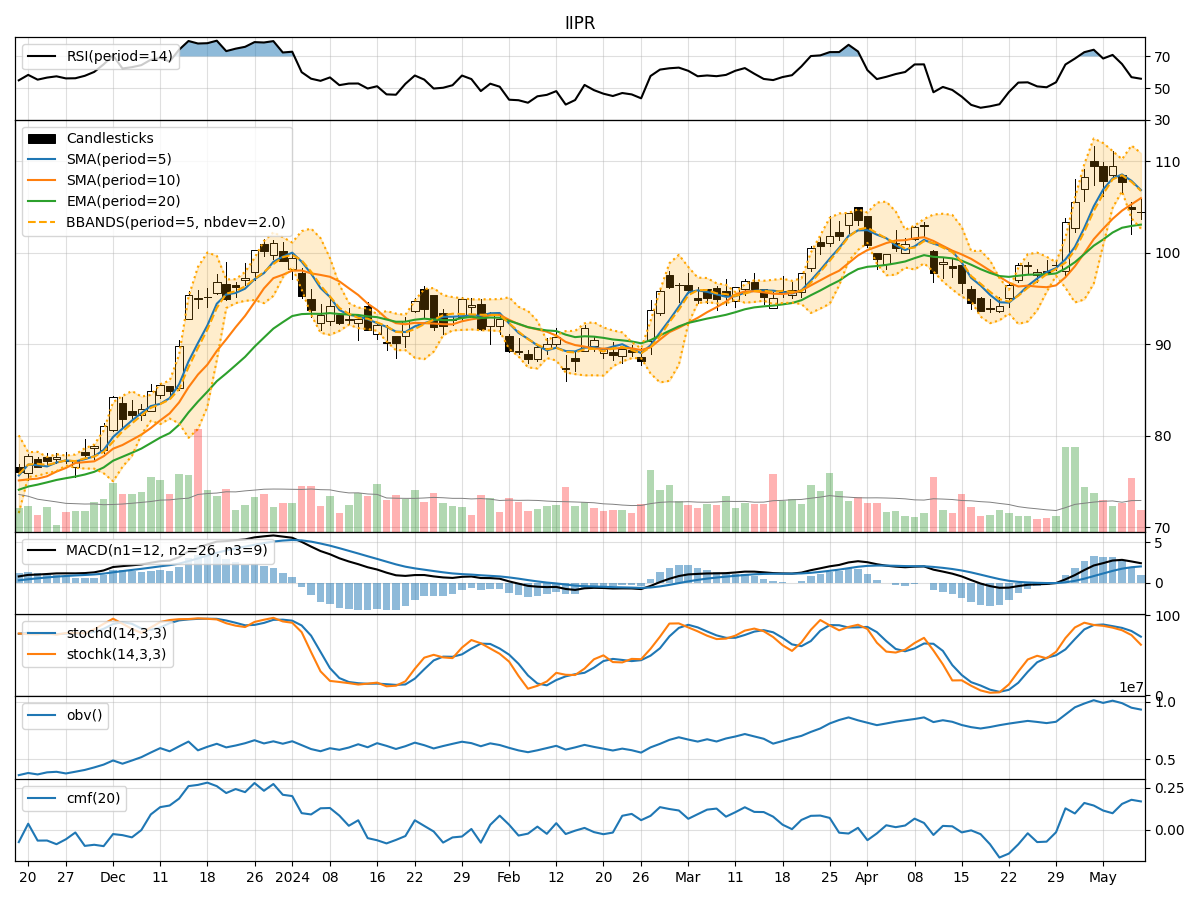
- Moving Averages (MA): The 5-day Moving Average (MA) has been fluctuating around the closing prices, indicating short-term price trends. The Simple Moving Average (SMA) and Exponential Moving Average (EMA) show a gradual increase over the period, suggesting a positive trend.
- MACD: The Moving Average Convergence Divergence (MACD) has been positive, with the MACD line consistently above the signal line. This indicates bullish momentum in the stock price.
- Conclusion: The trend indicators suggest an upward trend in the stock price.
Momentum Indicators:
- RSI: The Relative Strength Index (RSI) has been fluctuating but generally staying above 50, indicating bullish momentum.
- Stochastic Oscillator: Both %K and %D have been decreasing, moving towards the oversold region, suggesting a potential reversal in momentum.
- Conclusion: The momentum indicators show a mixed signal, with RSI indicating bullish momentum and Stochastic Oscillator hinting at a possible reversal.
Volatility Indicators:
- Bollinger Bands: The Bollinger Bands show narrowing volatility, with the stock price trading within the bands. This could indicate a period of consolidation.
- Conclusion: Volatility indicators suggest a sideways movement or consolidation phase in the stock price.
Volume Indicators:
- On-Balance Volume (OBV): The OBV has been fluctuating but generally showing an increase, indicating buying pressure.
- Chaikin Money Flow (CMF): The CMF has been positive, reflecting accumulation in the stock.
- Conclusion: Volume indicators point towards positive buying pressure in the stock.
Overall Conclusion:
Based on the analysis of the technical indicators, the stock of IIPR is likely to experience upward movement in the upcoming days. The trend indicators support a bullish outlook, while momentum indicators provide a mixed signal with a potential for a reversal. Volatility indicators suggest a period of consolidation, and volume indicators indicate positive buying pressure.
Recommendation:
Considering the overall analysis, it is advisable to consider buying IIPR stock in the short term, with a focus on monitoring the momentum indicators for any potential reversal signals. Traders should also be cautious of the consolidation phase indicated by volatility indicators and ensure proper risk management strategies are in place.
By combining insights from trend, momentum, volatility, and volume indicators, investors can make informed decisions to capitalize on potential price movements in IIPR stock.