Technical Analysis of IMAX 2024-05-10
Overview:
In analyzing the technical indicators for IMAX over the last 5 days, we will delve into the trend, momentum, volatility, and volume indicators to provide a comprehensive outlook on the possible stock price movement in the coming days. By examining these key indicators, we aim to offer valuable insights and predictions for informed decision-making.
Trend Analysis:
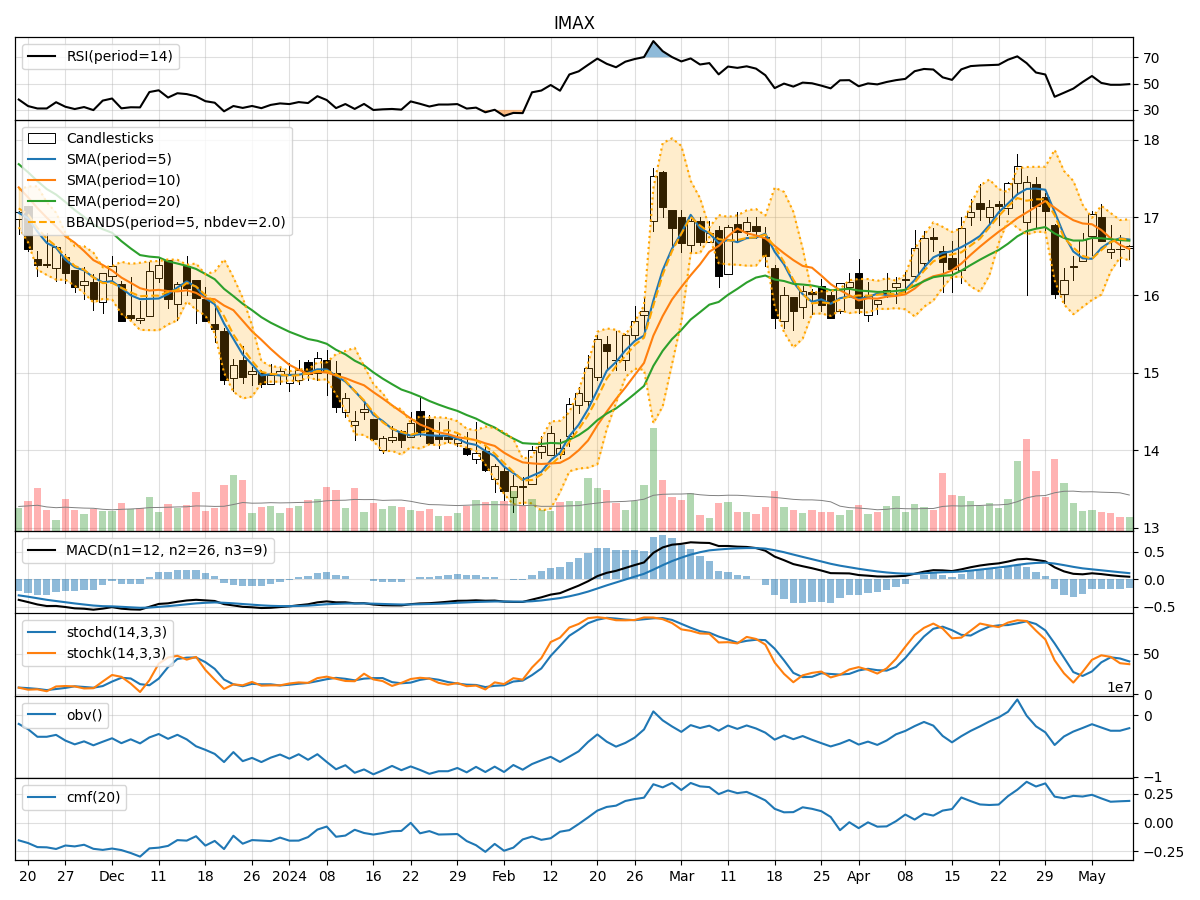
- Moving Averages (MA): The 5-day Moving Average (MA) has been relatively stable around the closing prices, indicating a consistent trend.
- MACD and Signal Line: The MACD line has been positive, suggesting a bullish momentum, although the gap between the MACD and Signal Line has been narrowing.
- Relative Strength Index (RSI): The RSI has been fluctuating around the mid-level, indicating a balanced momentum without extreme overbought or oversold conditions.
Momentum Analysis:
- Stochastic Oscillator: The Stochastic Oscillator has been gradually decreasing, moving towards oversold territory, signaling a potential reversal in momentum.
- Williams %R (Willr): The Williams %R has been trending lower, approaching oversold levels, indicating a possible buying opportunity in the near term.
Volatility Analysis:
- Bollinger Bands (BB): The Bollinger Bands have been narrowing, suggesting decreasing volatility and a potential period of consolidation.
- Bollinger Band %B (bbp): The %B indicator has been hovering around the middle range, indicating a neutral stance in terms of volatility.
Volume Analysis:
- On-Balance Volume (OBV): The OBV has been relatively stable, indicating a balance between buying and selling pressure.
- Chaikin Money Flow (CMF): The CMF has shown a slight increase, reflecting a positive inflow of money into the stock.
Conclusion:
Based on the analysis of the technical indicators, the stock of IMAX is likely to experience sideways movement in the coming days. The narrowing Bollinger Bands and decreasing Stochastic Oscillator suggest a period of consolidation and potential price stability. The positive MACD line and stable OBV indicate a balanced market sentiment. However, the approaching oversold levels in the Stochastic Oscillator and Williams %R signal a possible short-term buying opportunity. Overall, the stock is expected to trade within a range with no clear directional bias in the near future.
Key Takeaways:
- Trend: Stable with a slight bullish bias.
- Momentum: Potential reversal in momentum towards oversold levels.
- Volatility: Decreasing volatility, indicating consolidation.
- Volume: Balanced buying and selling pressure.
Recommendation:
Considering the technical indicators and the current market dynamics, it is advisable for investors to monitor the stock closely for any signs of a breakout or reversal. Traders may consider buying opportunities near oversold levels indicated by the Stochastic Oscillator and Williams %R. However, it is essential to exercise caution and wait for confirmation signals before making any significant trading decisions.