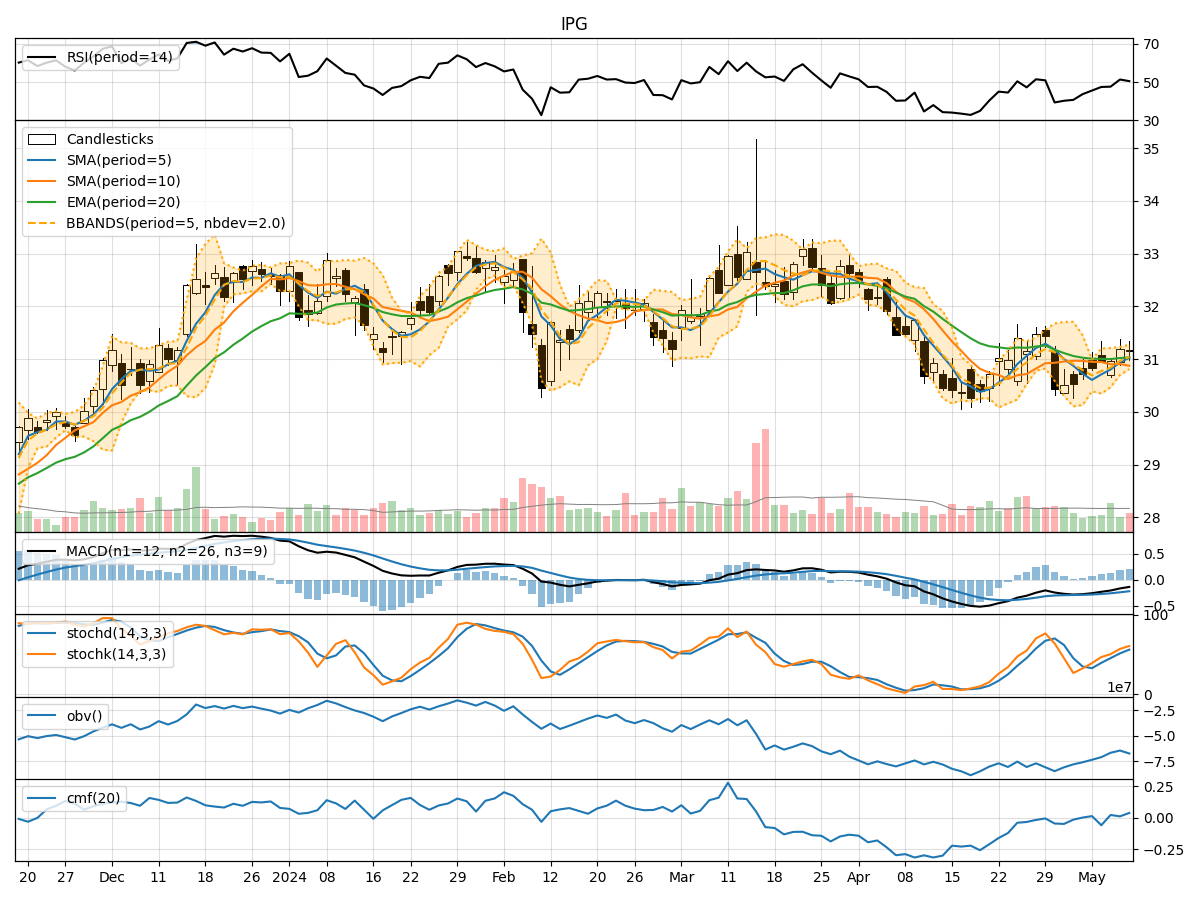
Technical Analysis of IPG 2024-05-10
Overview:
In analyzing the technical indicators for IPG stock over the last 5 days, we will delve into the trend, momentum, volatility, and volume indicators to provide a comprehensive outlook on the possible future stock price movement. By examining these key indicators, we aim to offer valuable insights and recommendations for potential investors.
Trend Analysis:
- Moving Averages (MA): The 5-day Moving Average (MA) has been trending slightly above the Simple Moving Average (SMA) and Exponential Moving Average (EMA) over the past 5 days, indicating a short-term upward trend.
- MACD: The MACD line has been consistently below the signal line, suggesting a bearish momentum in the stock price.
- Conclusion: The trend indicators show a mixed signal with a slight upward bias in the short term but a bearish momentum based on the MACD.
Momentum Analysis:
- RSI: The Relative Strength Index (RSI) has been fluctuating around the neutral level of 50, indicating a lack of strong momentum in either direction.
- Stochastic Oscillator: Both %K and %D lines of the Stochastic Oscillator have been in the overbought territory, suggesting a potential reversal or consolidation.
- Conclusion: The momentum indicators signal a neutral stance with a possibility of a reversal or consolidation in the near term.
Volatility Analysis:
- Bollinger Bands (BB): The stock price has been trading within the Bollinger Bands, with the bands narrowing over the last few days, indicating decreasing volatility.
- Conclusion: Volatility has been decreasing, which could lead to a period of consolidation or a breakout in the stock price.
Volume Analysis:
- On-Balance Volume (OBV): The OBV has shown mixed movements, indicating indecision among market participants regarding the stock.
- Chaikin Money Flow (CMF): The CMF has been positive but relatively low, suggesting some buying pressure but not significant.
- Conclusion: Volume indicators reflect a lack of strong conviction among investors, potentially leading to a period of sideways movement.
Overall Conclusion:
Based on the analysis of the technical indicators, the stock price of IPG is likely to experience sideways movement or consolidation in the next few days. The trend indicators show a slight upward bias, but the bearish momentum indicated by the MACD raises concerns. The neutral momentum and volume indicators further support the view of a potential consolidation phase. Traders may consider adopting a cautious approach and closely monitor key support and resistance levels for any potential breakout or reversal signals.
Key Recommendations:
- Monitor Support and Resistance Levels: Keep a close eye on key support and resistance levels to identify potential breakout or reversal points.
- Use Stop-Loss Orders: Implement stop-loss orders to manage risk in case of unexpected price movements.
- Wait for Confirmation: Wait for clear confirmation signals from multiple indicators before making significant trading decisions.
- Consider Short-Term Trades: Short-term traders may find opportunities within the expected sideways movement by utilizing range-bound strategies.
By staying informed and adapting to changing market conditions, investors can navigate the potential price movements of IPG stock effectively.