Technical Analysis of IVZ 2024-05-10
Overview:
In analyzing the technical indicators for IVZ over the last 5 days, we will delve into the trend, momentum, volatility, and volume indicators to provide a comprehensive outlook on the possible stock price movement in the coming days. By examining these key indicators, we aim to offer valuable insights and predictions for informed decision-making.
Trend Analysis:
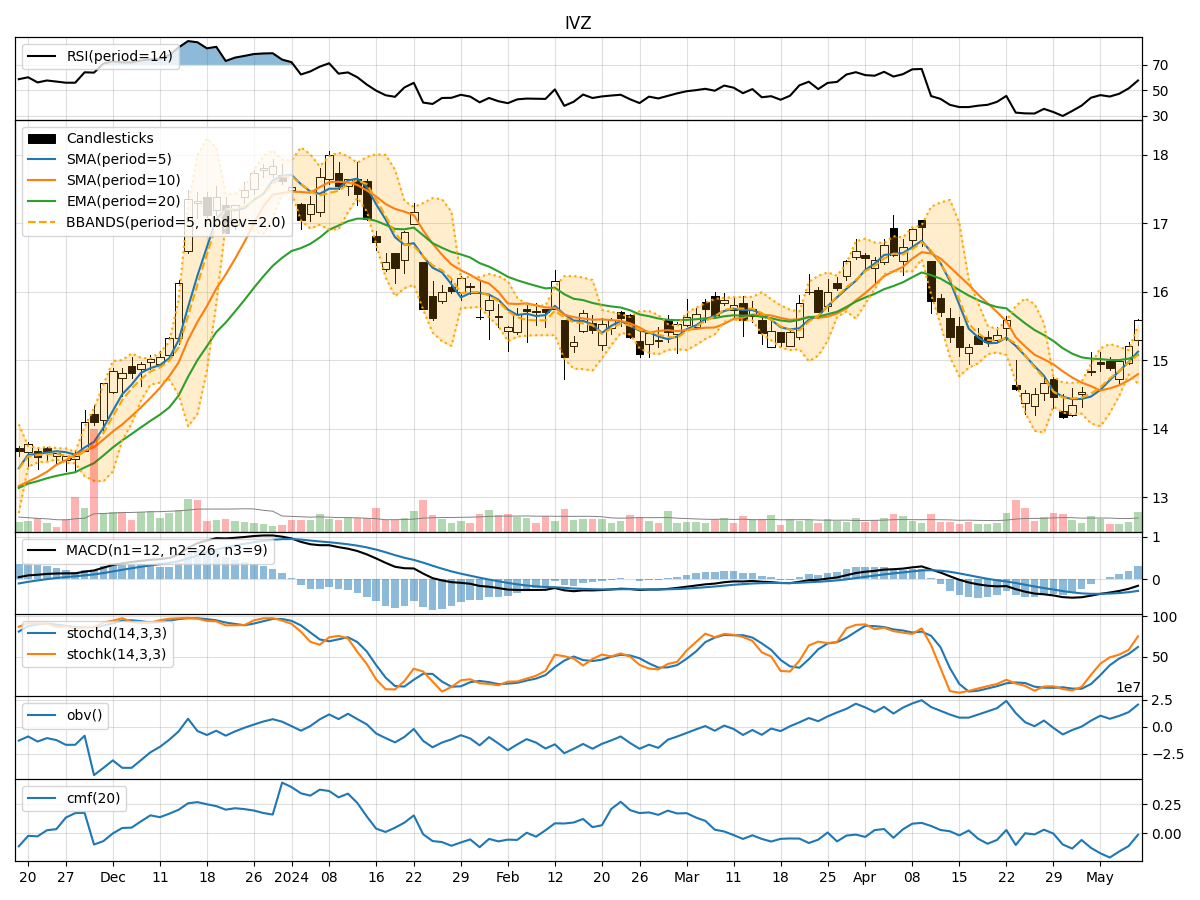
- Moving Averages (MA): The 5-day Moving Average (MA) has been consistently rising, indicating a bullish trend in the short term.
- MACD: The Moving Average Convergence Divergence (MACD) has shown a decreasing trend in the MACD line, suggesting a potential reversal or consolidation phase.
- EMA: The Exponential Moving Average (EMA) has been relatively stable, reflecting a neutral to slightly bullish sentiment.
Momentum Analysis:
- RSI: The Relative Strength Index (RSI) has been increasing, signaling strengthening momentum.
- Stochastic Oscillator: Both %K and %D have been rising, indicating increasing buying pressure.
- Williams %R: The Williams %R is close to oversold levels, suggesting a possible buying opportunity.
Volatility Analysis:
- Bollinger Bands (BB): The Bollinger Bands have widened, indicating increased volatility in the stock price.
- BB %B: The %B indicator is fluctuating within the bands, reflecting uncertainty in price direction.
Volume Analysis:
- On-Balance Volume (OBV): The OBV has been steadily increasing, showing accumulation by investors.
- Chaikin Money Flow (CMF): The CMF has been negative, indicating some selling pressure in the stock.
Key Observations:
- The trend indicators suggest a mixed outlook with a bullish short-term MA but a potential reversal indicated by the MACD.
- Momentum indicators show a positive momentum building up with RSI and Stochastic Oscillator on the rise.
- Volatility has increased, as seen in the widening Bollinger Bands, which may lead to more significant price swings.
- Volume indicators reflect a divergence, with OBV showing accumulation while CMF signals selling pressure.
Conclusion:
Based on the analysis of the technical indicators, the next few days for IVZ stock price movement could be upward in the short term. The positive momentum indicated by RSI and Stochastic Oscillator, coupled with the bullish MA, suggests a potential continuation of the upward trend. However, caution is advised due to the potential reversal signal from the MACD and the increased volatility as shown by the Bollinger Bands. Investors should closely monitor price action and key support/resistance levels for timely decision-making.