Technical Analysis of JCI 2024-05-10
Overview:
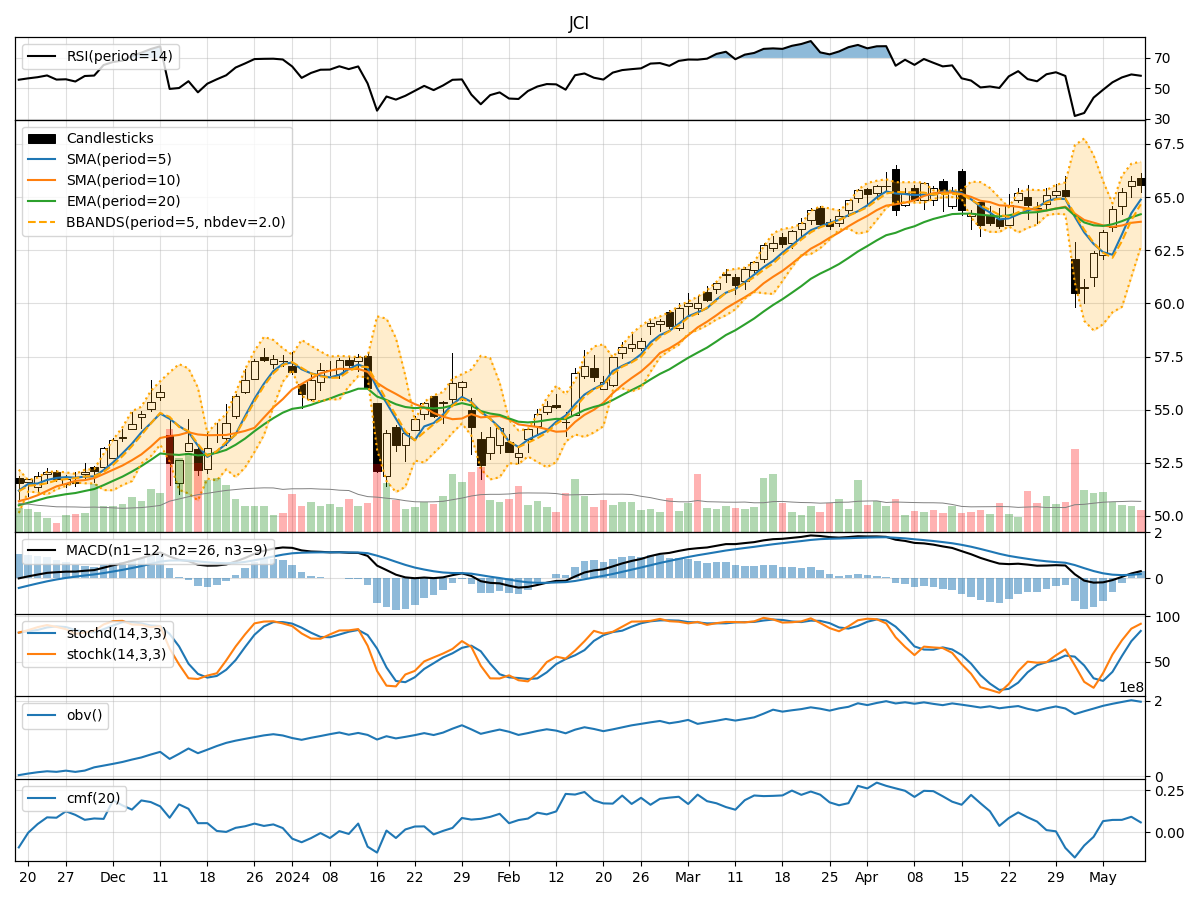
In analyzing the technical indicators for JCI over the last 5 days, we will delve into the trend, momentum, volatility, and volume indicators to provide a comprehensive outlook on the possible stock price movement in the coming days. By examining these key indicators, we aim to offer valuable insights and predictions for informed decision-making.
Trend Indicators:
- Moving Averages (MA): The 5-day Moving Average has been consistently above the longer-term Simple Moving Average (SMA) and Exponential Moving Average (EMA), indicating a short-term bullish trend.
- MACD: The MACD line has been above the signal line for the past few days, with the MACD Histogram showing an increasing positive trend, suggesting bullish momentum.
Momentum Indicators:
- RSI: The Relative Strength Index (RSI) has been trending upwards and is currently in the neutral zone, indicating potential room for further price appreciation.
- Stochastic Oscillator: Both %K and %D lines of the Stochastic Oscillator are in the overbought territory, suggesting a potential pullback in the short term.
Volatility Indicators:
- Bollinger Bands (BB): The stock price has been trading within the Bollinger Bands, with the bands widening slightly, indicating increased volatility.
- Bollinger %B: The %B indicator is currently above 0.5, suggesting the stock is trading above the middle band and potentially in an uptrend.
Volume Indicators:
- On-Balance Volume (OBV): The OBV has been showing a positive trend, indicating that volume has been higher on up days compared to down days.
- Chaikin Money Flow (CMF): The CMF has been fluctuating but is currently positive, suggesting buying pressure in the market.
Key Observations and Opinions:
- Trend: The trend indicators point towards a bullish sentiment in the short term, supported by the moving averages and MACD.
- Momentum: While the RSI indicates a neutral stance, the Stochastic Oscillator suggests a potential overbought scenario, signaling a possible correction.
- Volatility: The widening Bollinger Bands and %B above 0.5 indicate increased volatility and a potential uptrend continuation.
- Volume: The OBV and CMF both show positive signs, supporting the bullish outlook in the short term.
Conclusion:
Based on the analysis of the technical indicators, the next few days for JCI are likely to see further upward movement in the stock price. However, caution is advised as the Stochastic Oscillator signals potential overbought conditions, which could lead to a short-term pullback or consolidation. Traders should closely monitor price action and key support levels to manage risk effectively.