Technical Analysis of JWN 2024-05-10
Overview:
In analyzing the technical indicators for JWN over the last 5 days, we will delve into the trend, momentum, volatility, and volume indicators to provide a comprehensive outlook on the possible stock price movement in the coming days.
Trend Analysis:
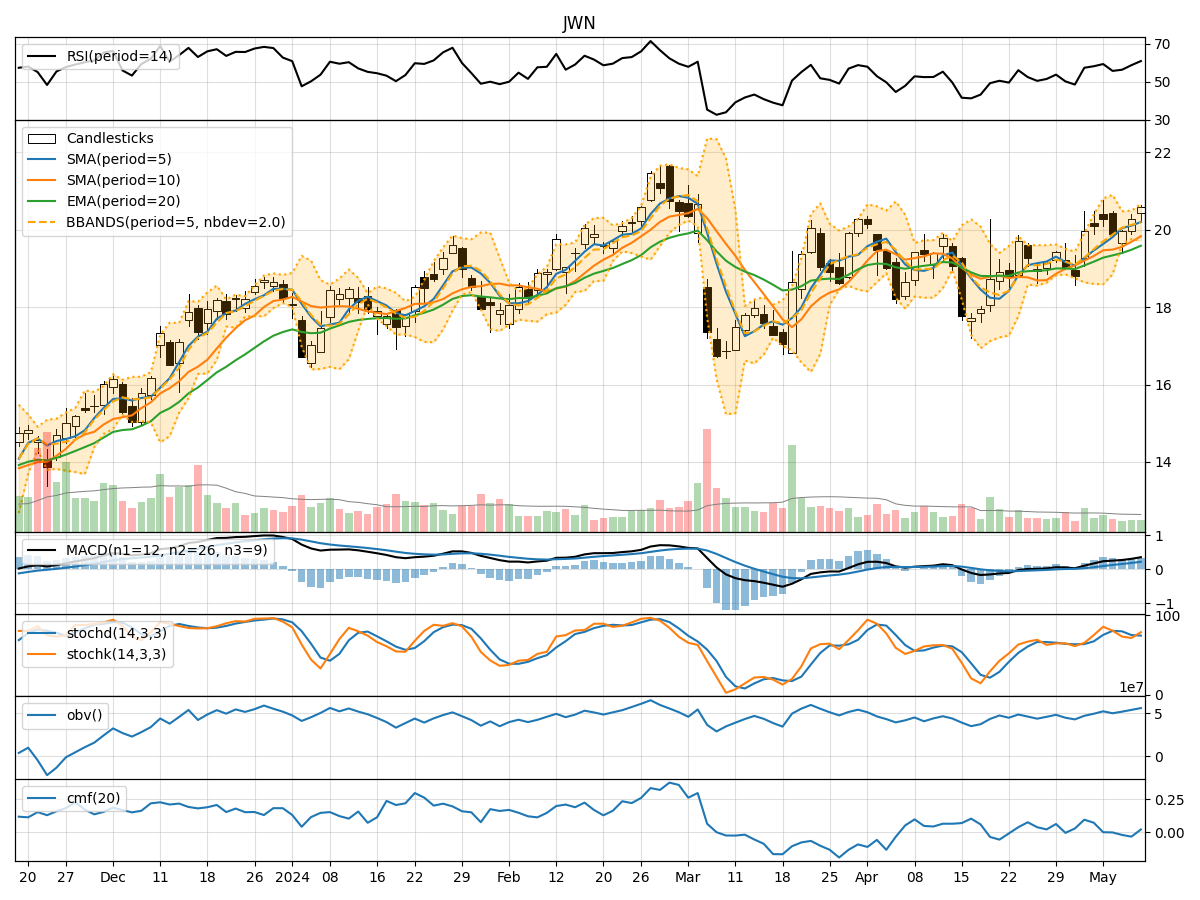
- Moving Averages (MA): The 5-day Moving Average (MA) has been consistently above the Simple Moving Average (SMA) and Exponential Moving Average (EMA), indicating a bullish trend.
- MACD: The MACD line has been steadily increasing, with the MACD line above the signal line, suggesting a bullish momentum.
Momentum Analysis:
- RSI: The Relative Strength Index (RSI) has been in the neutral zone, indicating neither overbought nor oversold conditions.
- Stochastic Oscillator: Both %K and %D have shown fluctuations but are currently in the overbought region, suggesting a potential reversal.
Volatility Analysis:
- Bollinger Bands (BB): The stock price has been trading within the Bollinger Bands, with the bands widening slightly, indicating increased volatility.
- Bollinger %B (BBP): The %B indicator is above 0.5, suggesting a bullish sentiment.
Volume Analysis:
- On-Balance Volume (OBV): The OBV has shown an overall increase, indicating accumulation by investors.
- Chaikin Money Flow (CMF): The CMF has been negative, signaling some selling pressure in the stock.
Conclusion:
Based on the analysis of the technical indicators, the next few days for JWN could see further upward movement in the stock price. The bullish trend indicated by the moving averages and MACD, coupled with the neutral RSI and overbought Stochastic Oscillator, suggest a potential continuation of the current uptrend. The widening Bollinger Bands and positive Bollinger %B further support the bullish view. Despite some selling pressure indicated by the CMF, the overall picture leans towards a bullish outlook for JWN in the near term.
Key Takeaways:
- Bullish Trend: Moving averages and MACD signal a bullish sentiment.
- Momentum: RSI is neutral, while Stochastic Oscillator shows overbought conditions.
- Volatility: Bollinger Bands widening indicate increased volatility.
- Volume: OBV suggests accumulation, while CMF shows slight selling pressure.
In conclusion, considering the technical indicators and the current market dynamics, the outlook for JWN in the next few days appears bullish. Investors may consider maintaining or initiating long positions in anticipation of further price appreciation.