Technical Analysis of KBR 2024-05-10
Overview:
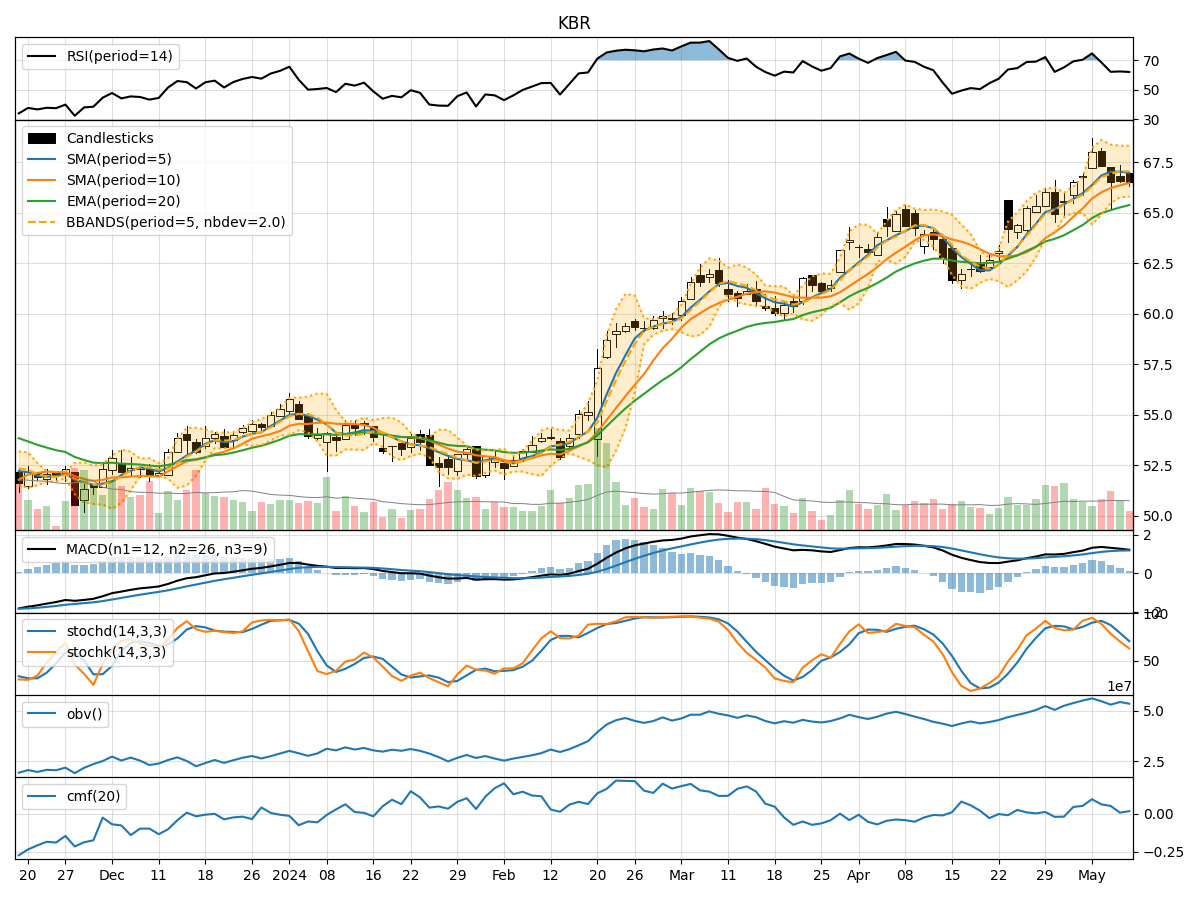
In analyzing the technical indicators for KBR over the last 5 days, we will delve into the trend, momentum, volatility, and volume indicators to provide a comprehensive outlook on the possible stock price movement in the coming days.
Trend Analysis:
- Moving Averages (MA): The 5-day Moving Average (MA) has been consistently above the Simple Moving Average (SMA) and Exponential Moving Average (EMA), indicating a bullish trend.
- MACD: The MACD line has been above the signal line, with both lines showing an upward trend, suggesting bullish momentum.
Momentum Analysis:
- RSI: The Relative Strength Index (RSI) has been fluctuating around the 60-70 range, indicating a neutral momentum.
- Stochastic Oscillator: Both %K and %D have been declining, moving towards the oversold territory, signaling a potential reversal.
Volatility Analysis:
- Bollinger Bands (BB): The stock price has been trading within the Bollinger Bands, with the bands narrowing, indicating decreasing volatility.
Volume Analysis:
- On-Balance Volume (OBV): The OBV has been fluctuating, showing no clear trend in volume accumulation.
- Chaikin Money Flow (CMF): The CMF has been positive but decreasing, suggesting a weakening buying pressure.
Key Observations:
- The trend indicators suggest a bullish sentiment, supported by the moving averages and MACD.
- Momentum indicators show a neutral stance, with the RSI hovering in the middle range and stochastic indicators pointing towards a potential reversal.
- Volatility has been decreasing, indicating a possible period of consolidation.
- Volume indicators lack a clear trend, with OBV and CMF showing mixed signals.
Conclusion:
Based on the analysis of the technical indicators, the next few days for KBR stock price movement could be sideways with a slight bearish bias. The bullish trend indicated by moving averages and MACD might face resistance due to the neutral momentum and potential reversal signaled by stochastic indicators. The decreasing volatility suggests a period of consolidation, while the mixed volume signals imply uncertainty in market participation. Traders should exercise caution and closely monitor key support and resistance levels for potential trading opportunities.