Technical Analysis of KD 2024-05-10
Overview:
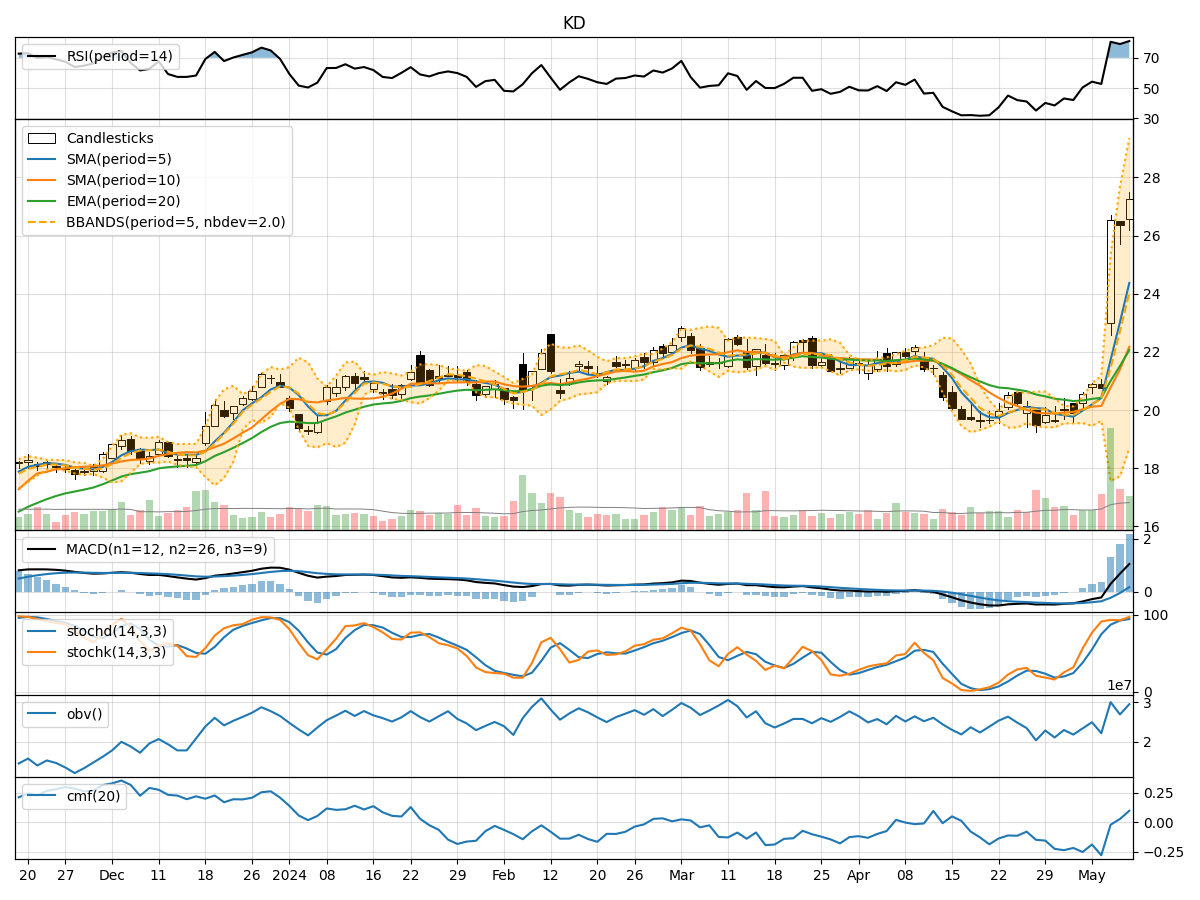
In analyzing the provided technical indicators for the last 5 days, we will delve into the trend, momentum, volatility, and volume indicators to forecast the possible stock price movement for the next few days. By examining these key aspects, we aim to provide a comprehensive and insightful analysis to guide your decision-making process.
Trend Indicators:
- Moving Averages (MA): The 5-day moving average has been consistently increasing, indicating a bullish trend in the short term.
- MACD: The MACD line has been above the signal line for the past few days, suggesting a bullish momentum.
- RSI: The RSI values have been relatively high, indicating overbought conditions but also reflecting strong bullish momentum.
Momentum Indicators:
- Stochastic Oscillator: Both %K and %D values have been in the overbought territory, signaling a strong bullish momentum.
- Williams %R: The Williams %R is also in the oversold region, indicating a potential reversal to the upside.
Volatility Indicators:
- Bollinger Bands: The widening of the Bollinger Bands suggests increased volatility in the stock price.
Volume Indicators:
- On-Balance Volume (OBV): The OBV has shown mixed signals, with some days indicating distribution and others accumulation.
- Chaikin Money Flow (CMF): The CMF has been mostly negative, indicating selling pressure in the market.
Key Observations and Opinions:
- Trend: The stock is currently in an upward trend based on moving averages and MACD.
- Momentum: The momentum indicators suggest a strong bullish sentiment in the market.
- Volatility: The widening Bollinger Bands indicate increased volatility, which could lead to larger price swings.
- Volume: The volume indicators show mixed signals, with OBV indicating some accumulation but CMF reflecting selling pressure.
Conclusion:
Based on the analysis of the technical indicators, the stock is likely to experience further upward movement in the next few days. The bullish trend, strong momentum, and increased volatility all point towards a potential continuation of the current uptrend. However, it is essential to monitor the volume indicators closely to confirm the sustainability of the upward movement. Overall, the outlook for the stock appears bullish in the short term.