Technical Analysis of KEYS 2024-05-10
Overview:
In analyzing the technical indicators for KEYS over the last 5 days, we will delve into the trend, momentum, volatility, and volume indicators to provide a comprehensive outlook on the possible stock price movement in the coming days. By examining these key indicators, we aim to offer valuable insights and predictions for potential investors.
Trend Indicators:
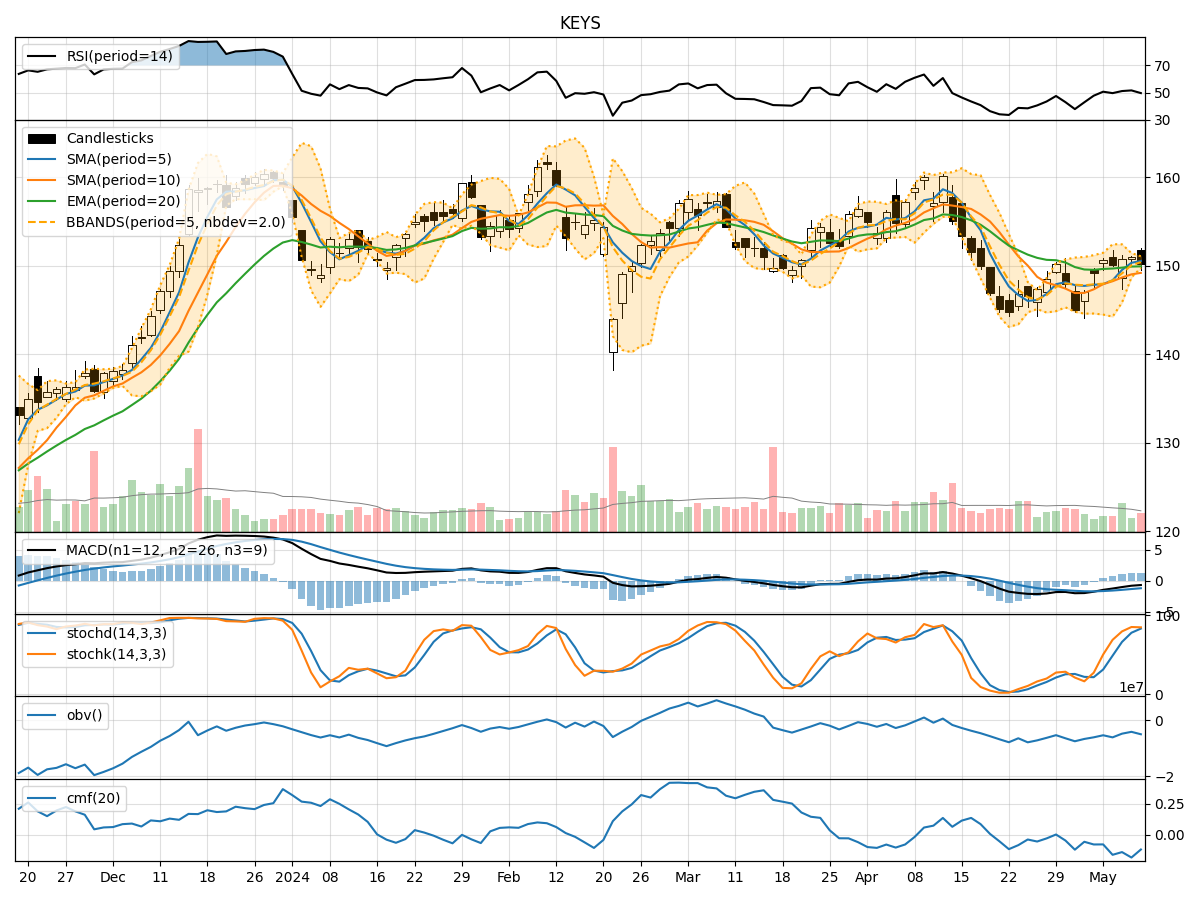
- Moving Averages (MA): The 5-day MA has been consistently above the 10-day SMA, indicating a short-term bullish trend. The EMA(20) has shown a slight upward trend, suggesting positive momentum.
- MACD: The MACD line has been above the signal line for the past few days, indicating bullish momentum.
- Conclusion: The trend indicators suggest an upward momentum in the stock price.
Momentum Indicators:
- RSI: The RSI has been fluctuating around the 50 level, indicating a neutral stance in momentum.
- Stochastic Oscillator: Both %K and %D have been in the overbought territory, suggesting a potential reversal.
- Conclusion: The momentum indicators signal a neutral to slightly bearish sentiment.
Volatility Indicators:
- Bollinger Bands (BB): The stock price has been trading within the bands, with the %B indicator showing a range-bound movement.
- Conclusion: Volatility indicators point towards a sideways movement in the stock price.
Volume Indicators:
- On-Balance Volume (OBV): The OBV has shown mixed signals, indicating indecision among investors.
- Chaikin Money Flow (CMF): The CMF has been negative, suggesting selling pressure.
- Conclusion: Volume indicators reflect a neutral to slightly bearish sentiment.
Key Observations:
- The trend indicators suggest an upward momentum, supported by the MACD and moving averages.
- Momentum indicators show a neutral to slightly bearish outlook, with the RSI hovering around 50 and stochastic oscillators in the overbought zone.
- Volatility indicators indicate a sideways movement, with the stock price trading within the Bollinger Bands.
- Volume indicators reflect a neutral to slightly bearish sentiment, with mixed signals from OBV and negative CMF.
Conclusion:
Based on the analysis of the technical indicators, the next few days for KEYS stock price are likely to see a sideways movement with a neutral to slightly bearish bias. Investors should closely monitor the momentum indicators for any potential shifts in market sentiment. It is advisable to exercise caution and wait for clearer signals before making significant trading decisions.