Technical Analysis of KKR 2024-05-31
Overview:
In analyzing the technical indicators for KKR over the last 5 days, we will delve into the trend, momentum, volatility, and volume indicators to provide a comprehensive outlook on the possible stock price movement in the coming days. By examining these key aspects, we aim to offer valuable insights and predictions for potential investors and traders.
Trend Indicators:
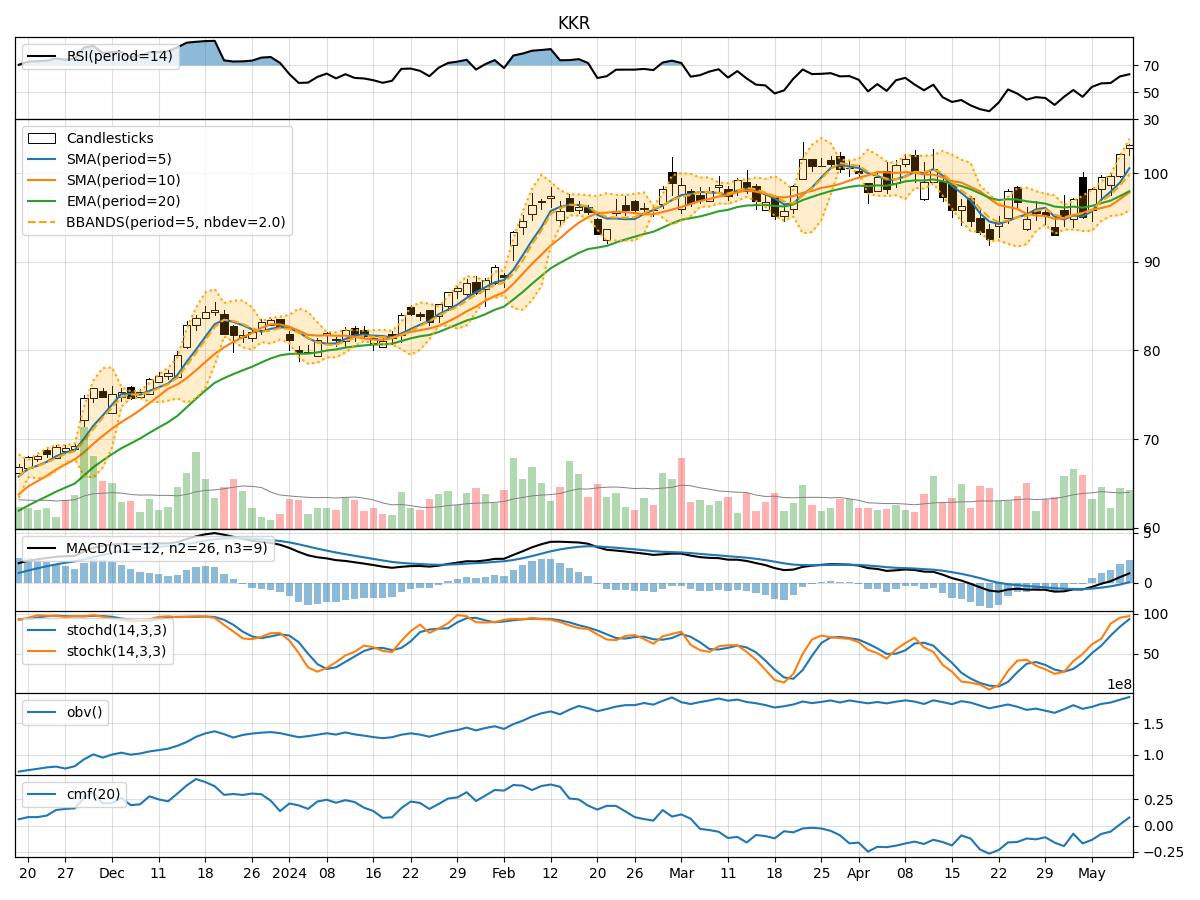
- Moving Averages (MA): The 5-day moving average has been fluctuating around the 105 level, indicating a relatively stable trend in the short term. Both the simple moving average (SMA) and exponential moving average (EMA) have shown a slight upward trend, suggesting a potential bullish sentiment.
- MACD: The MACD line has been decreasing over the past few days, indicating a weakening bullish momentum. The MACD histogram has also been declining, signaling a potential shift towards a bearish phase.
Momentum Indicators:
- RSI: The Relative Strength Index (RSI) has been hovering around the mid-level, indicating a neutral sentiment in terms of momentum. There is no clear overbought or oversold signal based on the RSI.
- Stochastic Oscillator: Both %K and %D lines of the Stochastic Oscillator have been declining, suggesting a loss in upward momentum. The current levels are approaching oversold territory, indicating a potential reversal or consolidation phase.
Volatility Indicators:
- Bollinger Bands (BB): The Bollinger Bands have been narrowing, indicating decreasing volatility in the stock price. The bands are currently close to each other, suggesting a period of consolidation or a potential breakout in the near future.
- Average True Range (ATR): The ATR has been decreasing, reflecting a decline in price volatility. This could signify a period of stability or indecision in the market.
Volume Indicators:
- On-Balance Volume (OBV): The OBV has shown mixed signals, with fluctuations in volume accumulation. The recent decrease in OBV could indicate some selling pressure in the stock.
- Chaikin Money Flow (CMF): The CMF has been relatively stable around the neutral level, indicating a balance between buying and selling pressure. There is no clear trend in volume flow based on the CMF.
Conclusion:
Based on the analysis of the technical indicators, the stock of KKR appears to be in a consolidation phase with neutral to slightly bearish sentiment. The trend indicators suggest a potential bullish bias in the short term, but the weakening momentum and mixed volume signals indicate a lack of strong conviction in the market.
Considering the narrowing Bollinger Bands and decreasing volatility, we may expect a period of sideways movement or a potential breakout in the coming days. Traders should exercise caution and wait for clearer signals before taking significant positions. It is advisable to closely monitor key support and resistance levels for potential entry or exit points.
In conclusion, the next few days for KKR stock price movement are likely to be sideways with a slight bearish bias, with the possibility of a breakout depending on market developments and external factors. Investors should remain vigilant and adapt their strategies accordingly to navigate potential price fluctuations.