Technical Analysis of KMPR 2024-05-10
Overview:
In analyzing the technical indicators for KMPR over the last 5 days, we will delve into the trend, momentum, volatility, and volume indicators to provide a comprehensive outlook on the possible stock price movement. By examining these key aspects, we aim to offer valuable insights and predictions for the upcoming days.
Trend Analysis:
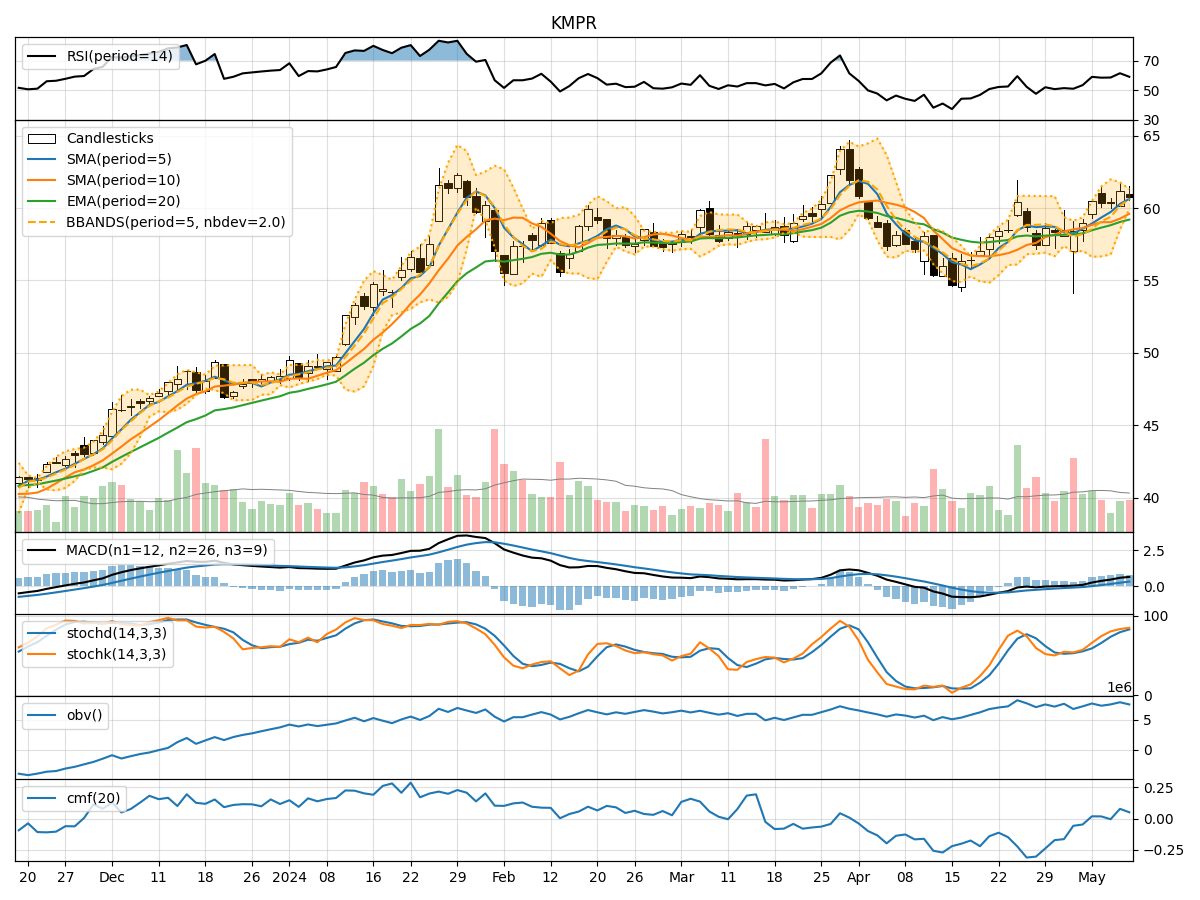
- Moving Averages (MA): The 5-day Moving Average (MA) has been consistently above the Simple Moving Average (SMA) and Exponential Moving Average (EMA), indicating a bullish trend.
- MACD: The MACD line has been consistently above the signal line, with both lines showing an upward trend, suggesting bullish momentum.
Momentum Analysis:
- RSI: The Relative Strength Index (RSI) has been fluctuating around the overbought territory, indicating strong buying pressure.
- Stochastic Oscillator: Both %K and %D lines of the Stochastic Oscillator have been in the overbought zone, signaling a potential reversal or consolidation.
Volatility Analysis:
- Bollinger Bands (BB): The stock price has been trading within the Bollinger Bands, with the bands widening, suggesting increased volatility.
Volume Analysis:
- On-Balance Volume (OBV): The OBV has shown mixed signals, indicating indecision among investors.
- Chaikin Money Flow (CMF): The CMF has been positive, reflecting buying pressure in the market.
Key Observations:
- The trend indicators suggest a strong bullish sentiment in the stock.
- Momentum indicators point towards a potential overbought scenario, signaling a need for caution.
- Volatility indicators indicate an increase in price fluctuations.
- Volume indicators show mixed signals, reflecting uncertainty among market participants.
Conclusion:
Based on the analysis of the technical indicators, the next few days' possible stock price movement for KMPR is likely to continue in an upward direction. However, considering the overbought signals in the momentum indicators, there might be a short-term consolidation or pullback before the uptrend resumes. Traders should closely monitor the Stochastic Oscillator for potential reversal signals and keep an eye on the OBV for confirmation of buying pressure. Overall, the outlook remains bullish with a short-term cautionary stance.