Technical Analysis of KNX 2024-05-10
Overview:
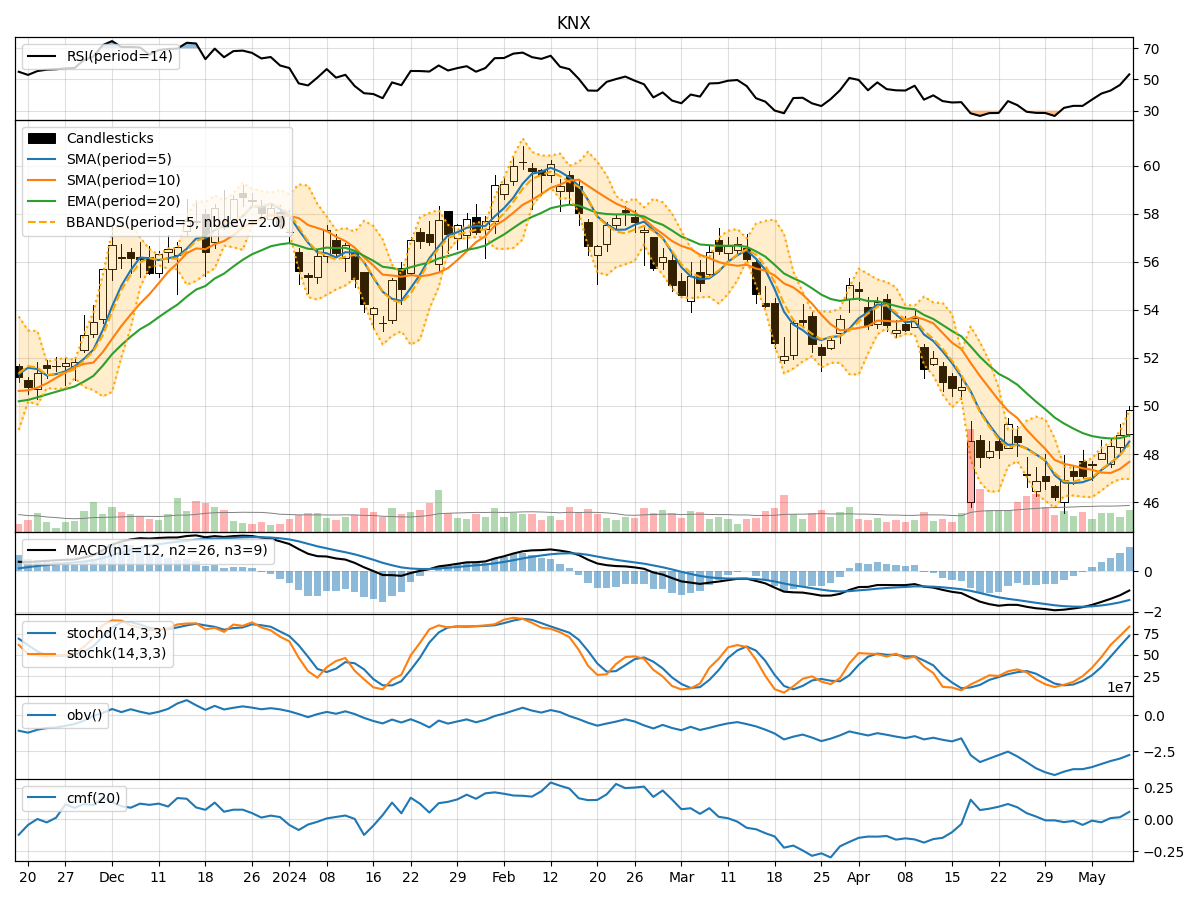
In analyzing the technical indicators for KNX over the last 5 days, we will delve into the trend, momentum, volatility, and volume indicators to provide a comprehensive outlook on the possible stock price movement. By examining these key factors, we aim to offer valuable insights and predictions for the upcoming days.
Trend Analysis:
- Moving Averages (MA): The 5-day Moving Average (MA) has been showing an upward trend, indicating a positive momentum in the stock price.
- MACD: The Moving Average Convergence Divergence (MACD) has been consistently increasing, suggesting a strengthening bullish momentum.
- EMA: The Exponential Moving Average (EMA) has been on an upward trajectory, supporting the bullish sentiment in the short to medium term.
Momentum Analysis:
- RSI: The Relative Strength Index (RSI) has been rising steadily, indicating increasing buying pressure and potential overbought conditions.
- Stochastic Oscillator: Both %K and %D of the Stochastic Oscillator are in the overbought zone, signaling a strong bullish momentum.
- Williams %R: The Williams %R is close to the oversold territory, suggesting a potential reversal or consolidation.
Volatility Analysis:
- Bollinger Bands (BB): The Bollinger Bands are widening, indicating increased volatility in the stock price.
- BB% (Bollinger Band %B): The BB% is relatively high, suggesting a potential overbought condition and a likely pullback or correction.
Volume Analysis:
- On-Balance Volume (OBV): The OBV has been showing a positive trend, indicating accumulation by investors.
- Chaikin Money Flow (CMF): The CMF is positive, reflecting buying pressure and potential bullish sentiment.
Key Observations:
- The trend indicators suggest a strong bullish sentiment in the stock price, supported by moving averages and MACD.
- Momentum indicators indicate a potential overbought condition, which might lead to a short-term correction or consolidation.
- Volatility is increasing, implying higher price fluctuations and the need for caution in trading decisions.
- Volume indicators show accumulation by investors, supporting the bullish bias in the stock.
Conclusion:
Based on the analysis of technical indicators, the next few days are likely to see continued upward movement in the stock price. However, caution is advised due to the potential overbought conditions highlighted by momentum indicators. Traders should closely monitor price action, key support and resistance levels, and be prepared for increased volatility. Overall, the outlook remains bullish with a possibility of a short-term correction or consolidation.