Technical Analysis of KOF 2024-05-10
Overview:
In analyzing the technical indicators for KOF over the last 5 days, we will delve into the trend, momentum, volatility, and volume indicators to provide a comprehensive outlook on the possible stock price movement in the coming days. By examining these key aspects, we aim to offer valuable insights and predictions for potential investors.
Trend Indicators:
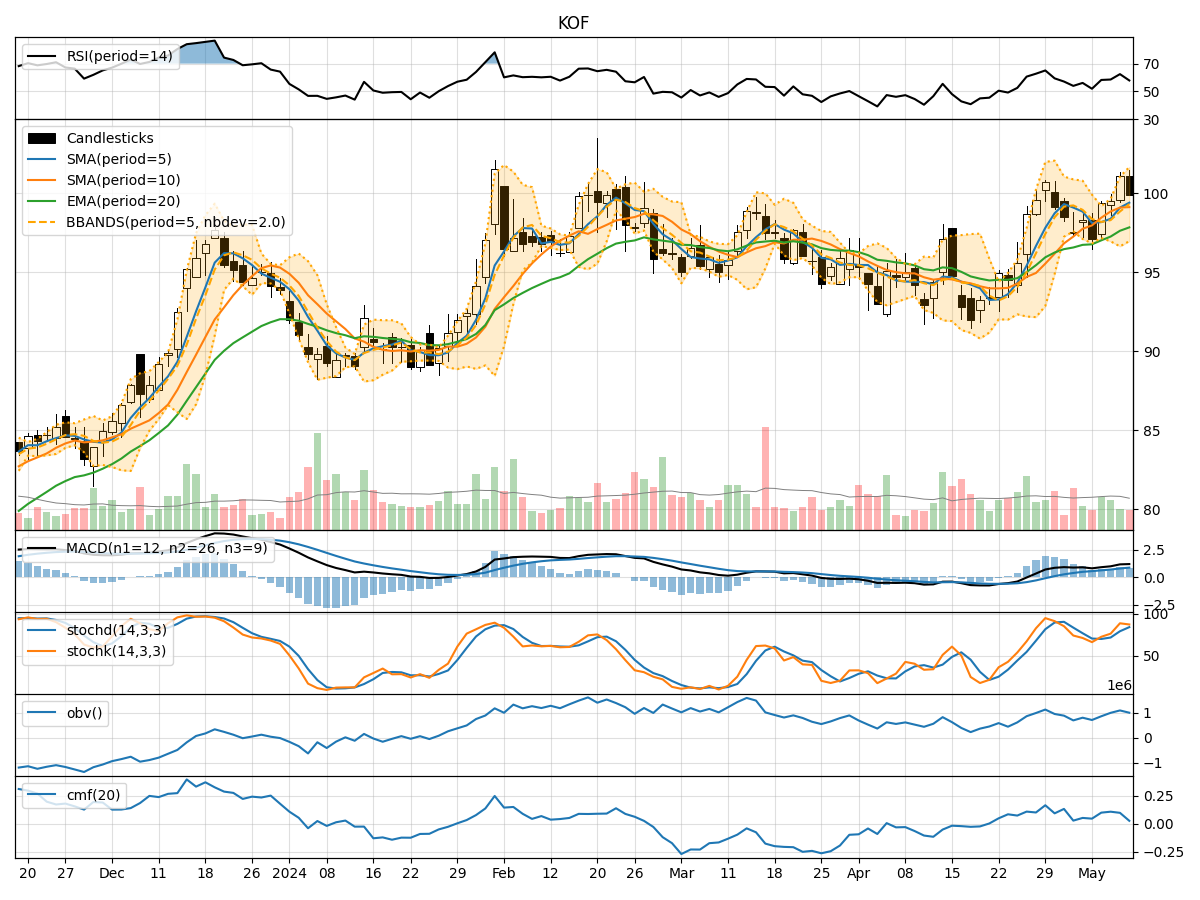
- Moving Averages (MA): The 5-day moving average has been consistently above the closing prices, indicating a short-term uptrend.
- MACD: The MACD line has been above the signal line for the past 5 days, suggesting bullish momentum.
Momentum Indicators:
- RSI: The RSI has been fluctuating around the 50 level, indicating a neutral momentum.
- Stochastic Oscillator: Both %K and %D have been in overbought territory, signaling a potential reversal.
Volatility Indicators:
- Bollinger Bands: The stock price has been trading within the upper Bollinger Band, suggesting an overbought condition.
Volume Indicators:
- On-Balance Volume (OBV): The OBV has been fluctuating, indicating indecision among investors.
- Chaikin Money Flow (CMF): The CMF has been positive but declining, signaling weakening buying pressure.
Key Observations:
- The trend indicators suggest a bullish sentiment in the short term.
- Momentum indicators show mixed signals with a potential reversal in the stochastic oscillator.
- Volatility indicators point towards an overbought condition.
- Volume indicators reflect indecision among investors with weakening buying pressure.
Conclusion:
Based on the analysis of the technical indicators, the stock price of KOF is likely to experience a short-term correction or consolidation in the coming days. The overbought condition indicated by the volatility indicators, coupled with the potential reversal in the stochastic oscillator, suggests a possible downward movement. Investors should exercise caution and consider waiting for a clearer trend confirmation before making any trading decisions.