Technical Analysis of KRC 2024-05-10
Overview:
In analyzing the technical indicators for KRC over the last 5 days, we will delve into the trend, momentum, volatility, and volume indicators to provide a comprehensive outlook on the possible stock price movement. By examining these key aspects, we aim to offer valuable insights and predictions for the upcoming days.
Trend Indicators:
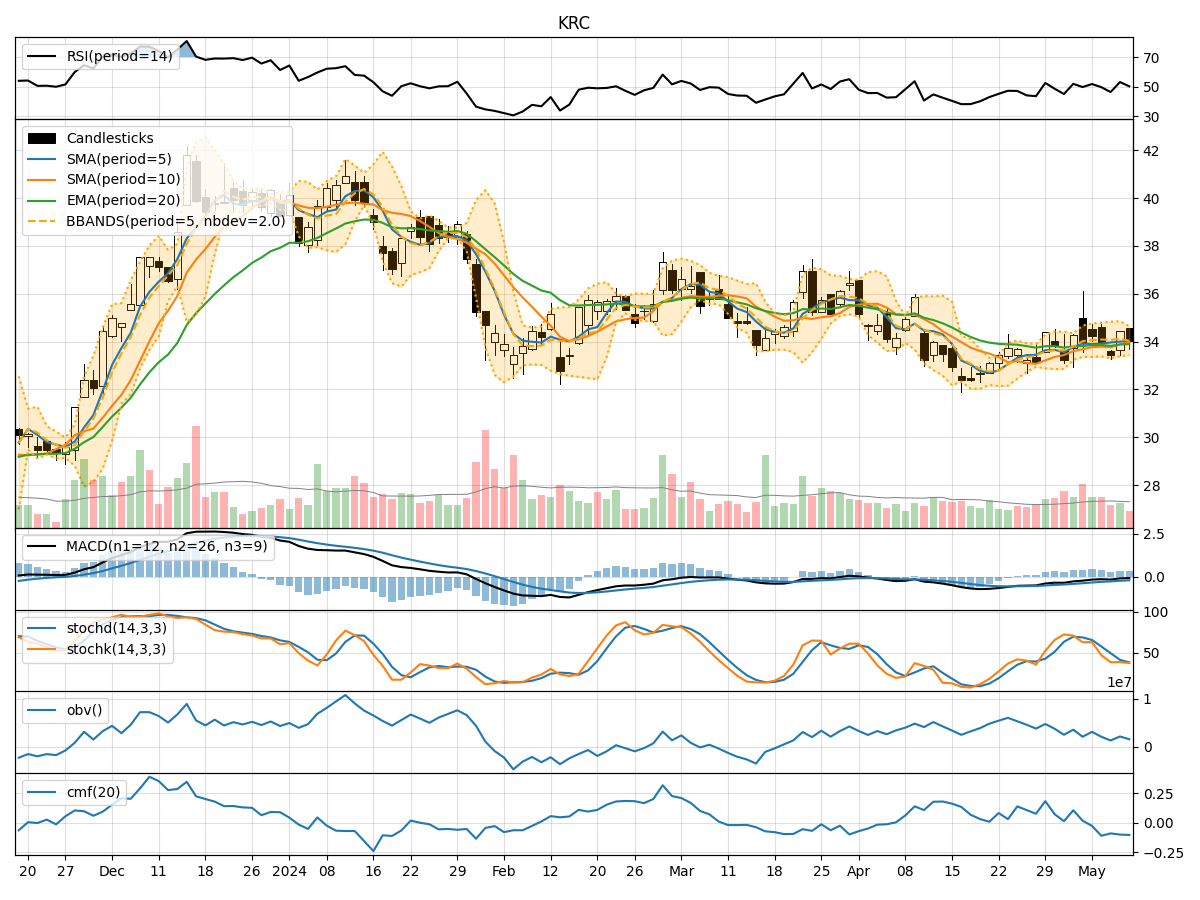
- Moving Averages (MA): The 5-day Moving Average (MA) has been relatively stable around $34, indicating a neutral trend.
- MACD: The Moving Average Convergence Divergence (MACD) has shown a slight positive divergence, suggesting a potential bullish momentum.
- EMA: The Exponential Moving Average (EMA) has been fluctuating around $33.85, indicating a sideways trend.
Momentum Indicators:
- RSI: The Relative Strength Index (RSI) has been hovering around the neutral zone, indicating a lack of strong momentum.
- Stochastic Oscillator: Both %K and %D have been in the oversold region, signaling a potential reversal in the near future.
- Williams %R: The Williams %R is also in the oversold territory, indicating a possible buying opportunity.
Volatility Indicators:
- Bollinger Bands: The Bollinger Bands have shown a narrowing of the bands, suggesting a decrease in volatility and a potential consolidation phase.
- Bollinger %B: The %B indicator is relatively low, indicating a possible oversold condition.
Volume Indicators:
- On-Balance Volume (OBV): The OBV has been declining, indicating selling pressure in the stock.
- Chaikin Money Flow (CMF): The CMF has been negative, suggesting a lack of buying interest in the stock.
Key Observations and Opinions:
- Trend: The trend indicators show a neutral to slightly bullish bias, with the MACD hinting at a potential uptrend.
- Momentum: Momentum indicators suggest a lack of strong momentum but show signs of a possible reversal from oversold levels.
- Volatility: Volatility indicators point towards a decrease in volatility and a potential consolidation phase.
- Volume: Volume indicators indicate selling pressure and a lack of significant buying interest in the stock.
Conclusion:
Based on the analysis of the technical indicators, the next few days for KRC stock price movement could see a sideways consolidation with a slight bullish bias. Traders may consider monitoring for a potential reversal in momentum from oversold levels indicated by the stochastic oscillator and Williams %R. However, caution is advised due to the lack of strong buying interest as shown by volume indicators. It is recommended to wait for confirmation of a clear trend before making significant trading decisions.