Technical Analysis of KRG 2024-05-31
Overview:
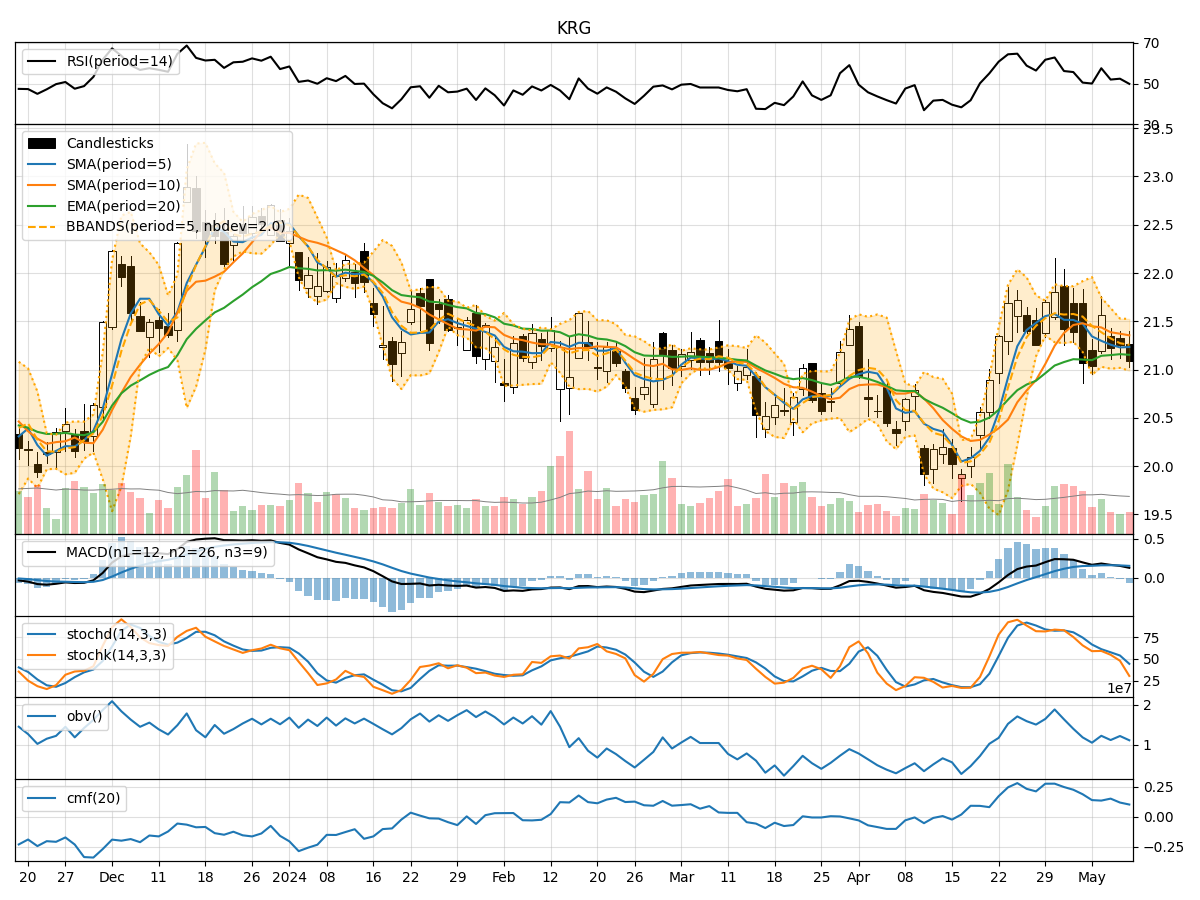
In analyzing the technical indicators for KRG stock over the last 5 days, we will delve into the trend, momentum, volatility, and volume indicators to provide a comprehensive outlook on the possible stock price movement in the coming days. By examining these key aspects, we aim to offer valuable insights and predictions for potential investors.
Trend Analysis:
- Moving Averages (MA): The 5-day Moving Average (MA) has been fluctuating around the closing prices, indicating short-term price trends. The Simple Moving Average (SMA) and Exponential Moving Average (EMA) show a mixed trend, with the EMA slightly lagging behind.
- MACD: The Moving Average Convergence Divergence (MACD) and its signal line (MACDH) have been negative, suggesting a bearish momentum in the stock price.
Momentum Analysis:
- RSI: The Relative Strength Index (RSI) has shown fluctuations but is currently in the neutral zone, indicating a balanced momentum.
- Stochastic Oscillator: Both %K and %D of the Stochastic Oscillator have been volatile, with %K crossing %D multiple times, reflecting indecision in price momentum.
- Williams %R: The Williams %R is in oversold territory, suggesting a potential reversal in price direction.
Volatility Analysis:
- Bollinger Bands (BB): The Bollinger Bands have widened, indicating increased price volatility. The current price is hovering around the lower band, suggesting a possible oversold condition.
Volume Analysis:
- On-Balance Volume (OBV): The OBV has shown mixed movements, indicating uncertainty in the buying and selling pressure.
- Chaikin Money Flow (CMF): The CMF has been negative, signaling a lack of buying pressure in the stock.
Key Observations:
- The trend indicators suggest a neutral to slightly bearish outlook, with the MACD signaling a bearish momentum.
- Momentum indicators show mixed signals, with RSI in a neutral zone and Stochastic Oscillator indicating indecision.
- Volatility has increased, as seen in the widening Bollinger Bands, potentially leading to more significant price swings.
- Volume indicators reflect uncertainty, with OBV showing mixed movements and CMF indicating a lack of buying pressure.
Conclusion:
Based on the analysis of the technical indicators, the stock price of KRG is likely to experience sideways movement in the coming days. The mixed signals from trend, momentum, volatility, and volume indicators suggest a lack of clear direction in the stock price. Investors should exercise caution and closely monitor further developments before making any trading decisions.