Technical Analysis of LAZ 2024-05-10
Overview:
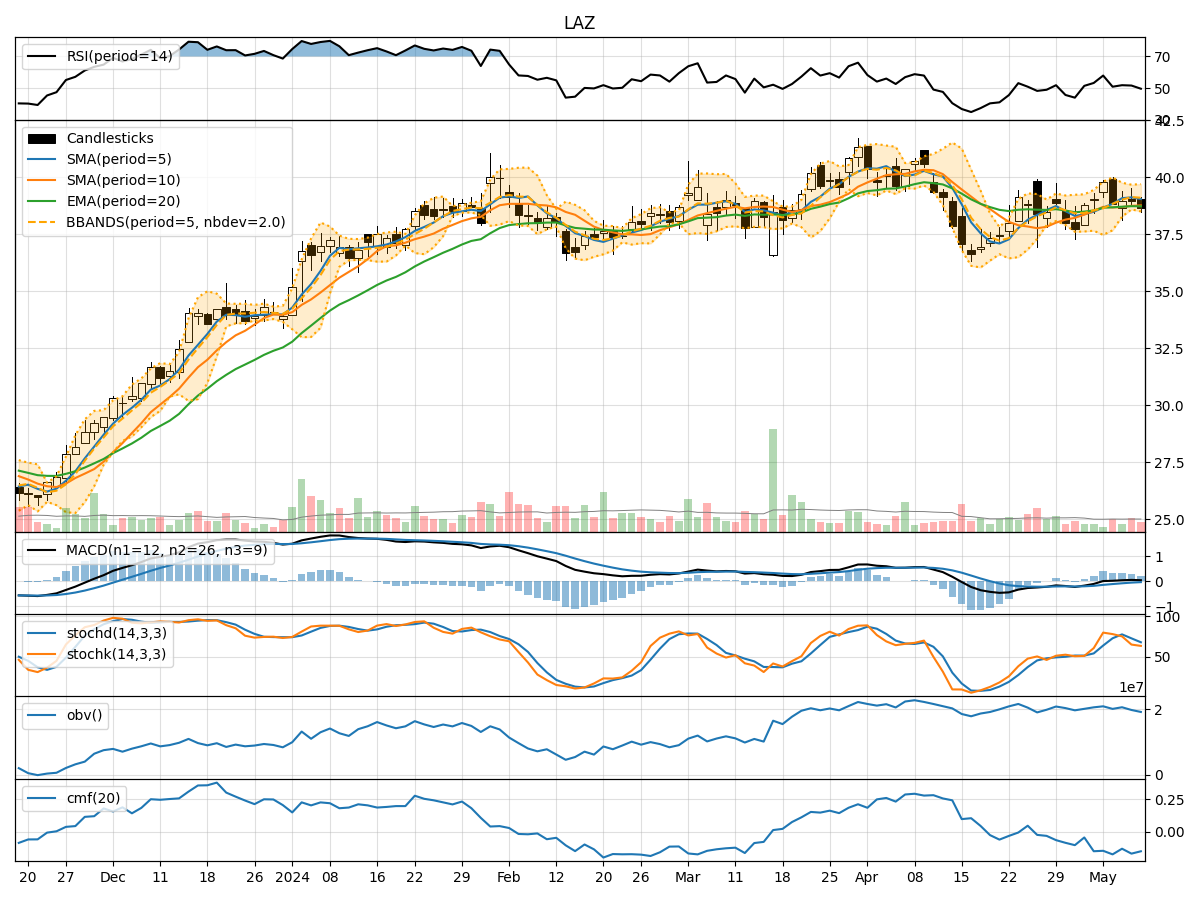
In the last 5 trading days, LAZ stock has shown mixed signals across various technical indicators. The trend indicators suggest a slightly bullish sentiment, with the moving averages trending upwards. Momentum indicators indicate a neutral to slightly bearish momentum, while volatility indicators show a narrowing of the Bollinger Bands, indicating potential consolidation. Volume indicators also suggest a neutral sentiment with no clear accumulation or distribution pattern.
Trend Analysis:
- Moving Averages (MA): The 5-day MA is above the 10-day SMA, indicating a short-term bullish trend. The EMA(20) is also trending upwards, supporting a bullish view.
- MACD: The MACD line is above the signal line, indicating a bullish momentum. However, the MACD histogram is decreasing, suggesting a potential weakening of the bullish momentum.
Momentum Analysis:
- RSI: The RSI is hovering around 50, indicating a neutral momentum with no clear overbought or oversold conditions.
- Stochastic Oscillator: The Stochastic indicators are in the neutral zone, suggesting a lack of strong momentum in either direction.
Volatility Analysis:
- Bollinger Bands (BB): The narrowing of the Bollinger Bands suggests decreasing volatility and a potential period of consolidation.
- Bollinger %B (BBP): The %B is below 0.5, indicating that the stock price is trading below the lower Bollinger Band, potentially oversold.
Volume Analysis:
- On-Balance Volume (OBV): The OBV is relatively flat, indicating no significant accumulation or distribution of the stock.
- Chaikin Money Flow (CMF): The CMF is negative, suggesting a slight outflow of money from the stock.
Conclusion:
Based on the analysis of the technical indicators, the next few days for LAZ stock are likely to see sideways movement with a slight bearish bias. The trend indicators point towards a bullish sentiment, but the weakening momentum and lack of strong volume support suggest a potential consolidation phase. The narrowing Bollinger Bands and negative CMF further support the view of a sideways movement. Traders may consider waiting for a clearer trend confirmation before making significant trading decisions.