Technical Analysis of LBRT 2024-05-10
Overview:
In analyzing the technical indicators for LBRT over the last 5 days, we will delve into the trend, momentum, volatility, and volume indicators to provide a comprehensive outlook on the possible stock price movement in the coming days. By examining key metrics such as moving averages, MACD, RSI, Bollinger Bands, and OBV, we aim to offer valuable insights and predictions for potential price action.
Trend Analysis:
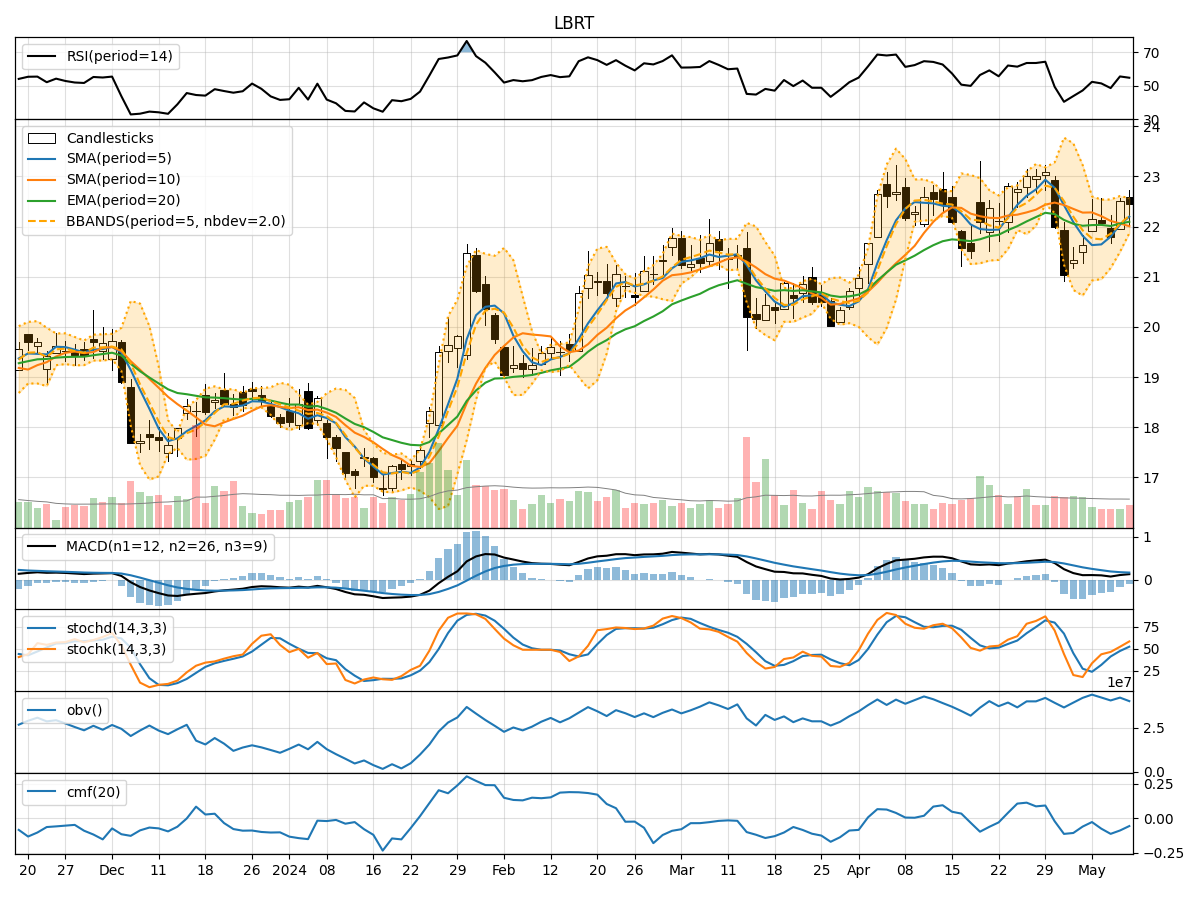
- Moving Averages (MA): The 5-day MA has been fluctuating around the closing prices, indicating short-term price trends. The stock has been trading below the 10-day SMA, suggesting a bearish sentiment.
- MACD: The MACD line has been consistently below the signal line, indicating a bearish trend. However, the MACD histogram has been narrowing, hinting at a possible trend reversal.
- Conclusion: The trend indicators suggest a bearish outlook in the short term, but with signs of a potential reversal.
Momentum Analysis:
- RSI: The RSI has been oscillating around the 50 level, reflecting indecision in the market. It has not entered overbought or oversold territory.
- Stochastic Oscillator: Both %K and %D have been rising, indicating increasing buying momentum. However, they are not in the overbought zone yet.
- Conclusion: Momentum indicators show a neutral stance with a slight inclination towards bullish momentum.
Volatility Analysis:
- Bollinger Bands (BB): The stock price has been trading within the bands, suggesting normal volatility. The bands have not shown any significant expansion or contraction.
- Conclusion: Volatility indicators point towards a stable price movement with no extreme fluctuations expected.
Volume Analysis:
- On-Balance Volume (OBV): The OBV has been declining, indicating selling pressure in the stock. This divergence from price movement suggests weakening bullish sentiment.
- Chaikin Money Flow (CMF): The CMF has been negative, indicating outflow of money from the stock.
- Conclusion: Volume indicators signal a bearish sentiment with decreasing buying interest.
Overall Conclusion:
Based on the analysis of trend, momentum, volatility, and volume indicators, the next few days' possible stock price movement for LBRT is likely to be sideways to slightly bearish. While trend indicators point towards a bearish bias, momentum indicators show a neutral to slightly bullish stance. Volatility remains stable, indicating no major price swings expected. However, volume indicators suggest a bearish sentiment with selling pressure prevailing.
Recommendation:
Considering the overall analysis, it is advisable to exercise caution in trading LBRT in the coming days. Traders may consider waiting for more clarity in price direction before taking significant positions. Monitoring key levels such as support and resistance can help in identifying potential entry and exit points. Additionally, keeping an eye on any news or external factors that may impact the stock's price movement is crucial for making informed decisions.
Disclaimer:
This analysis is based solely on technical indicators and historical data, and it is important to note that market conditions can change rapidly. It is recommended to conduct thorough research, consider fundamental factors, and consult with a financial advisor before making any investment decisions.