Technical Analysis of LEG 2024-05-10
Overview:
In analyzing the technical indicators for LEG stock over the last 5 days, we will delve into the trend, momentum, volatility, and volume indicators to provide a comprehensive outlook on the possible stock price movement in the coming days. By examining these key indicators, we aim to offer valuable insights and predictions to guide investment decisions.
Trend Analysis:
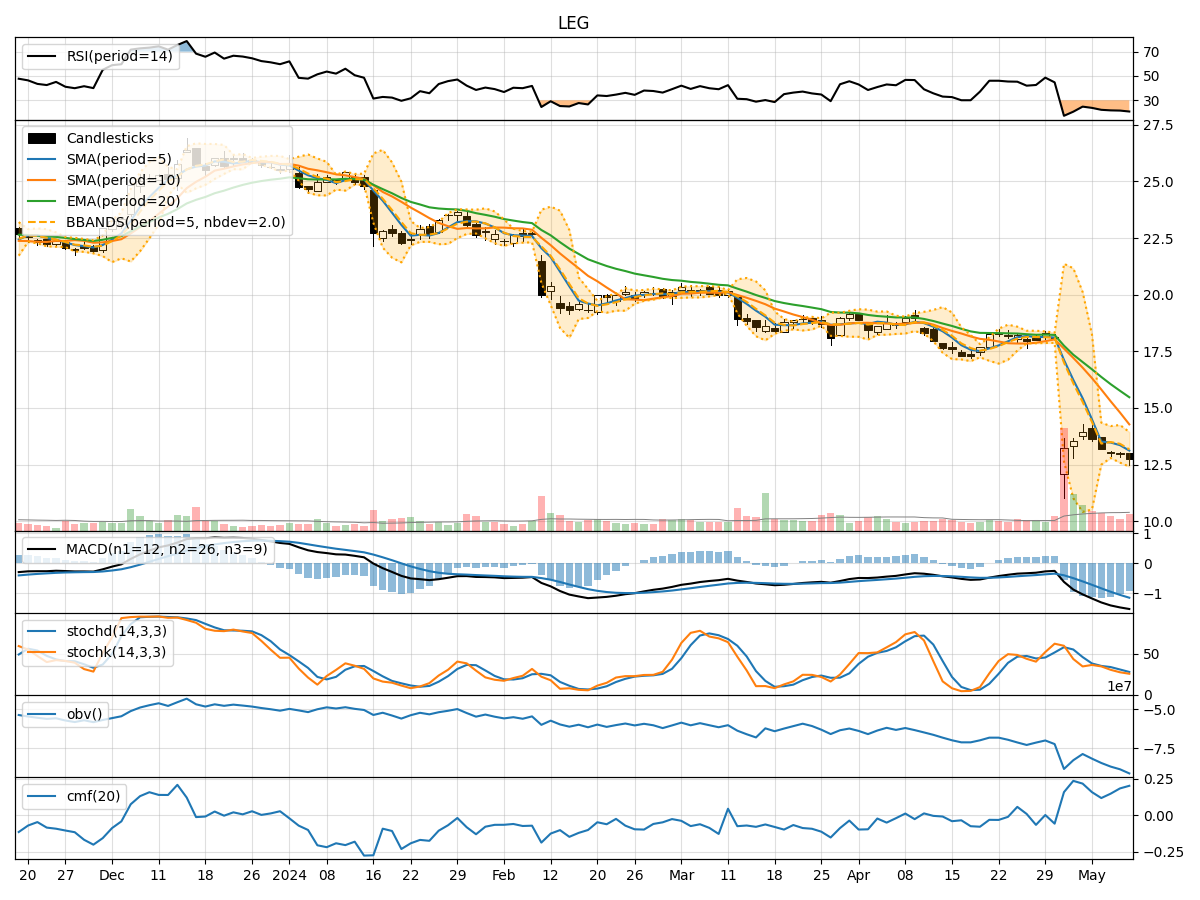
- Moving Averages (MA): The 5-day moving average has been consistently below the longer-term moving averages (SMA and EMA), indicating a downward trend in the stock price.
- MACD: The MACD line has been decreasing, with the MACD histogram also showing a downward trend, suggesting bearish momentum in the stock.
Momentum Analysis:
- RSI: The RSI has been declining and is currently in the oversold territory, indicating a potential reversal or continuation of the downtrend.
- Stochastic Oscillator: Both %K and %D have been decreasing, signaling a bearish momentum in the stock.
Volatility Analysis:
- Bollinger Bands (BB): The stock price has been consistently trading below the lower Bollinger Band, indicating oversold conditions and potential for a reversal.
Volume Analysis:
- On-Balance Volume (OBV): The OBV has been decreasing, suggesting that selling pressure has been dominant in the stock.
- Chaikin Money Flow (CMF): The CMF has been positive but relatively low, indicating some buying interest but not strong enough to reverse the downtrend.
Key Observations:
- The stock is currently in a downtrend based on moving averages and MACD indicators.
- Momentum indicators like RSI and Stochastic Oscillator suggest bearish momentum in the stock.
- Volatility indicators show that the stock is oversold according to Bollinger Bands.
- Volume indicators reflect selling pressure as seen in the declining OBV.
Conclusion:
Based on the analysis of the technical indicators, the next few days' possible stock price movement for LEG is likely to be downward. The stock is currently in a bearish phase, with indicators pointing towards further downside potential. Investors should exercise caution and consider waiting for signs of a reversal or stabilization before considering any long positions.