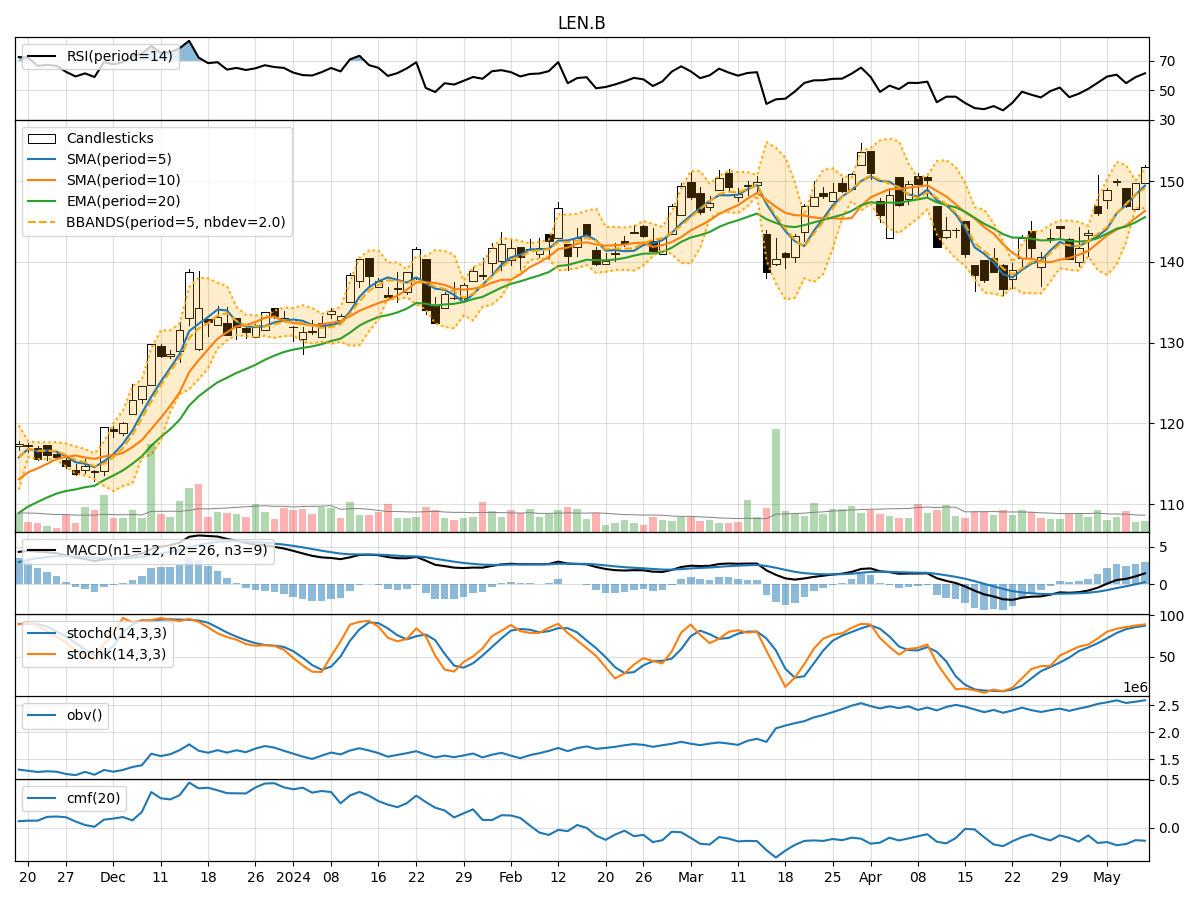
Technical Analysis of LEN.B 2024-05-10
Overview:
In analyzing the technical indicators for LEN.B over the last 5 days, we will delve into the trend, momentum, volatility, and volume indicators to provide a comprehensive outlook on the possible stock price movement in the coming days. By examining these key aspects, we aim to offer valuable insights and predictions for potential investors.
Trend Indicators:
- Moving Averages (MA): The 5-day moving average has been consistently above the longer-term moving averages (SMA and EMA), indicating a bullish trend.
- MACD: The MACD line has been consistently above the signal line, suggesting a bullish momentum.
- MACD Histogram: The histogram has been increasing, indicating strengthening bullish momentum.
Momentum Indicators:
- RSI: The RSI has been trending upwards, indicating increasing buying pressure.
- Stochastic Oscillator: Both %K and %D lines have been in the overbought zone, suggesting a strong bullish momentum.
- Williams %R: The indicator has been hovering near oversold levels, indicating a potential reversal to the upside.
Volatility Indicators:
- Bollinger Bands: The stock price has been trading within the bands, with the bands widening slightly, indicating increased volatility.
- Bollinger %B: The %B indicator has been fluctuating within a normal range, not signaling any extreme conditions.
Volume Indicators:
- On-Balance Volume (OBV): The OBV has been relatively stable, not showing significant divergence from price movements.
- Chaikin Money Flow (CMF): The CMF has been negative, indicating some selling pressure in the stock.
Key Observations and Opinions:
- Trend: The trend indicators suggest a strong bullish sentiment in the stock.
- Momentum: Momentum indicators indicate a robust buying momentum, with potential for further upside.
- Volatility: Volatility has slightly increased, but not to a concerning level.
- Volume: Volume indicators show a lack of significant divergence, indicating stability in trading activity.
Conclusion:
Based on the analysis of the technical indicators, the overall outlook for LEN.B is bullish in the coming days. The stock is likely to experience upward movement driven by strong buying momentum and a positive trend. Investors may consider buying positions in anticipation of further price appreciation. However, it is essential to monitor the indicators closely for any signs of reversal or divergence to adjust trading strategies accordingly.